

How to export TradingView chart data to CSV and generate on it
Export chart data from TradingView's chart menu as a CSV with a UNIX or ISO time column, then read it into AlphaPrime's Market Data Library with ASCII Import: symbol, bar size, exchange and columns come from the file, you fill in the contract spec, and the series is ready for strategy generation at the file's own timeframe.
By Soren Huang · Published · updated · Editorial policy
Contents
How do you export chart data from TradingView?
Export chart data writes the bars loaded on the chart to a CSV, and that file carries everything AlphaPrime (Valynox) needs: symbol, bar size, exchange and columns are read from it, so the import is a button, a file picker and one contract spec. Three stages: export, import, then generate. The same three for futures, forex and crypto.
- Open the symbol and the timeframe you want to generate on.
- Scroll the chart back, or drag the time axis, until all the bars you want are loaded.
- Open the chart layout menu: the arrow next to the layout name, beside Save.
- Choose Export chart data….
- Choose the time format: UNIX timestamp or ISO time. AlphaPrime reads both.
- Export.
The file is named after the exchange, the symbol and the bar size in minutes: CME_MINI_ES1!, 30.csv for the ES 30-minute chart, FX_EURUSD, 60.csv for EURUSD at 1 hour, BINANCE_BTCUSDT, 240.csv for BTCUSDT at 4 hours.
Inside, the columns are time, open, high, low, close, Volume, then one column per indicator that was on the chart. Indicator columns are set to Ignore at import, so a chart with a moving average on it exports fine.
How do you import the CSV into AlphaPrime?
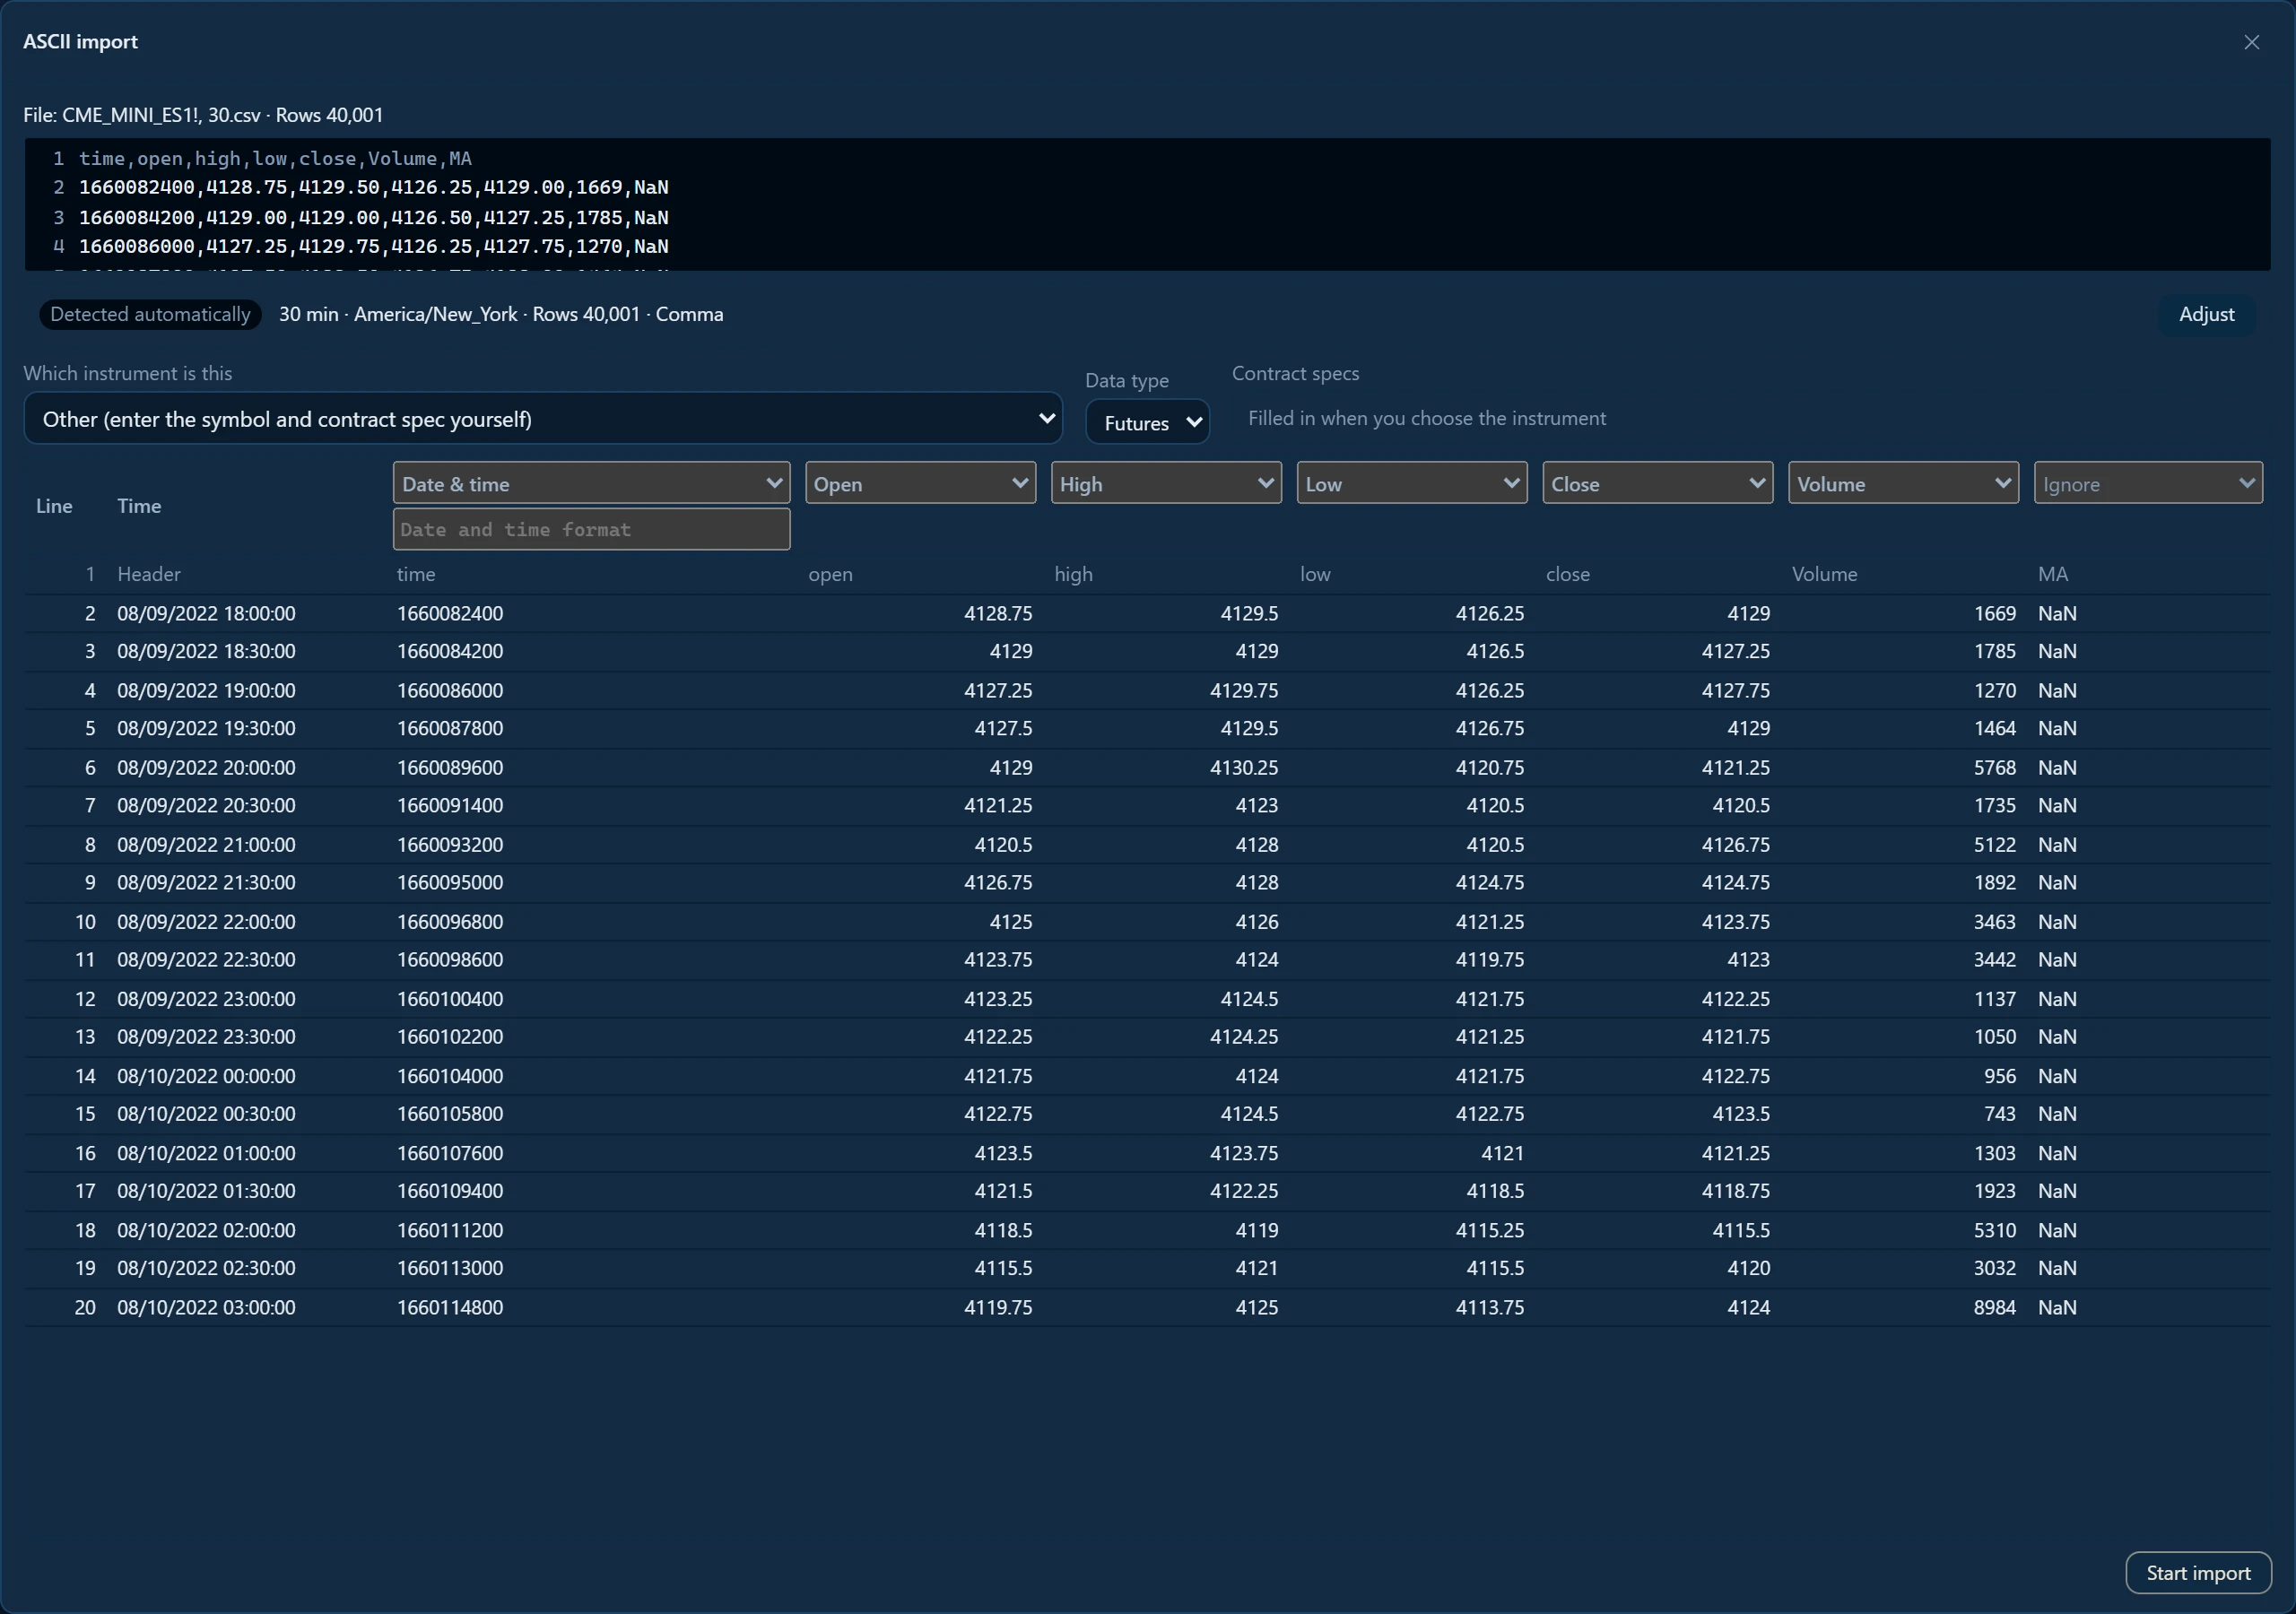
Market Data Library, the ASCII Import button at the top right, pick the file; the import dialog opens with the file already read.

The import dialog fills itself in from the file. The time column becomes the date-time column, UNIX or ISO alike; open, high, low, close and Volume are mapped to their fields; the MA column from the chart's indicator is set to Ignore; the bar size is detected as 30 min. From the file name, AlphaPrime sets the symbol to ES (from ES1!), the data type to Futures and the exchange to CME with its New York time zone, America/New_York, and the preview grid shows each row's time in that zone.
Forex and crypto files go the same way. A file named FX_EURUSD is set to Forex; a file named BINANCE_BTCUSDT is set to Crypto. Bar size, time column and price columns are read the same way as for ES.
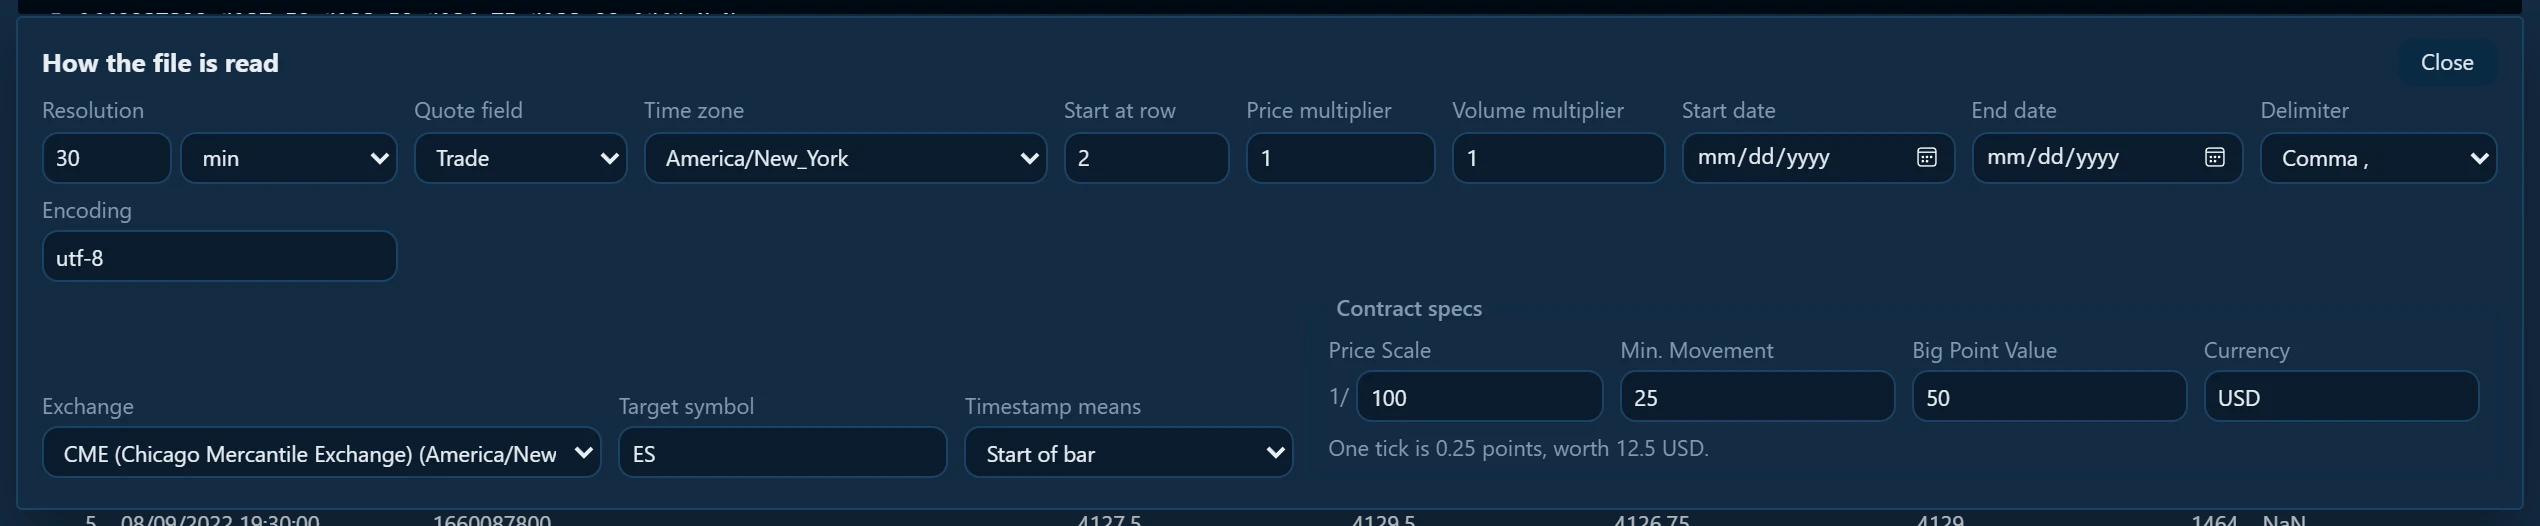
Click Adjust to see how the file is read and to fill in the contract spec. For ES the price scale is 1/100, the minimum movement 25, which is 0.25 of a point, the big point value 50 and the currency USD; the form answers with "one tick is 0.25 points, worth 12.5 USD", and futures backtesting done right: specs, rollover and tick value explains each field. For a forex pair or a crypto pair, type the same four fields, price scale, minimum movement, big point value and currency, with the values your broker or exchange uses.
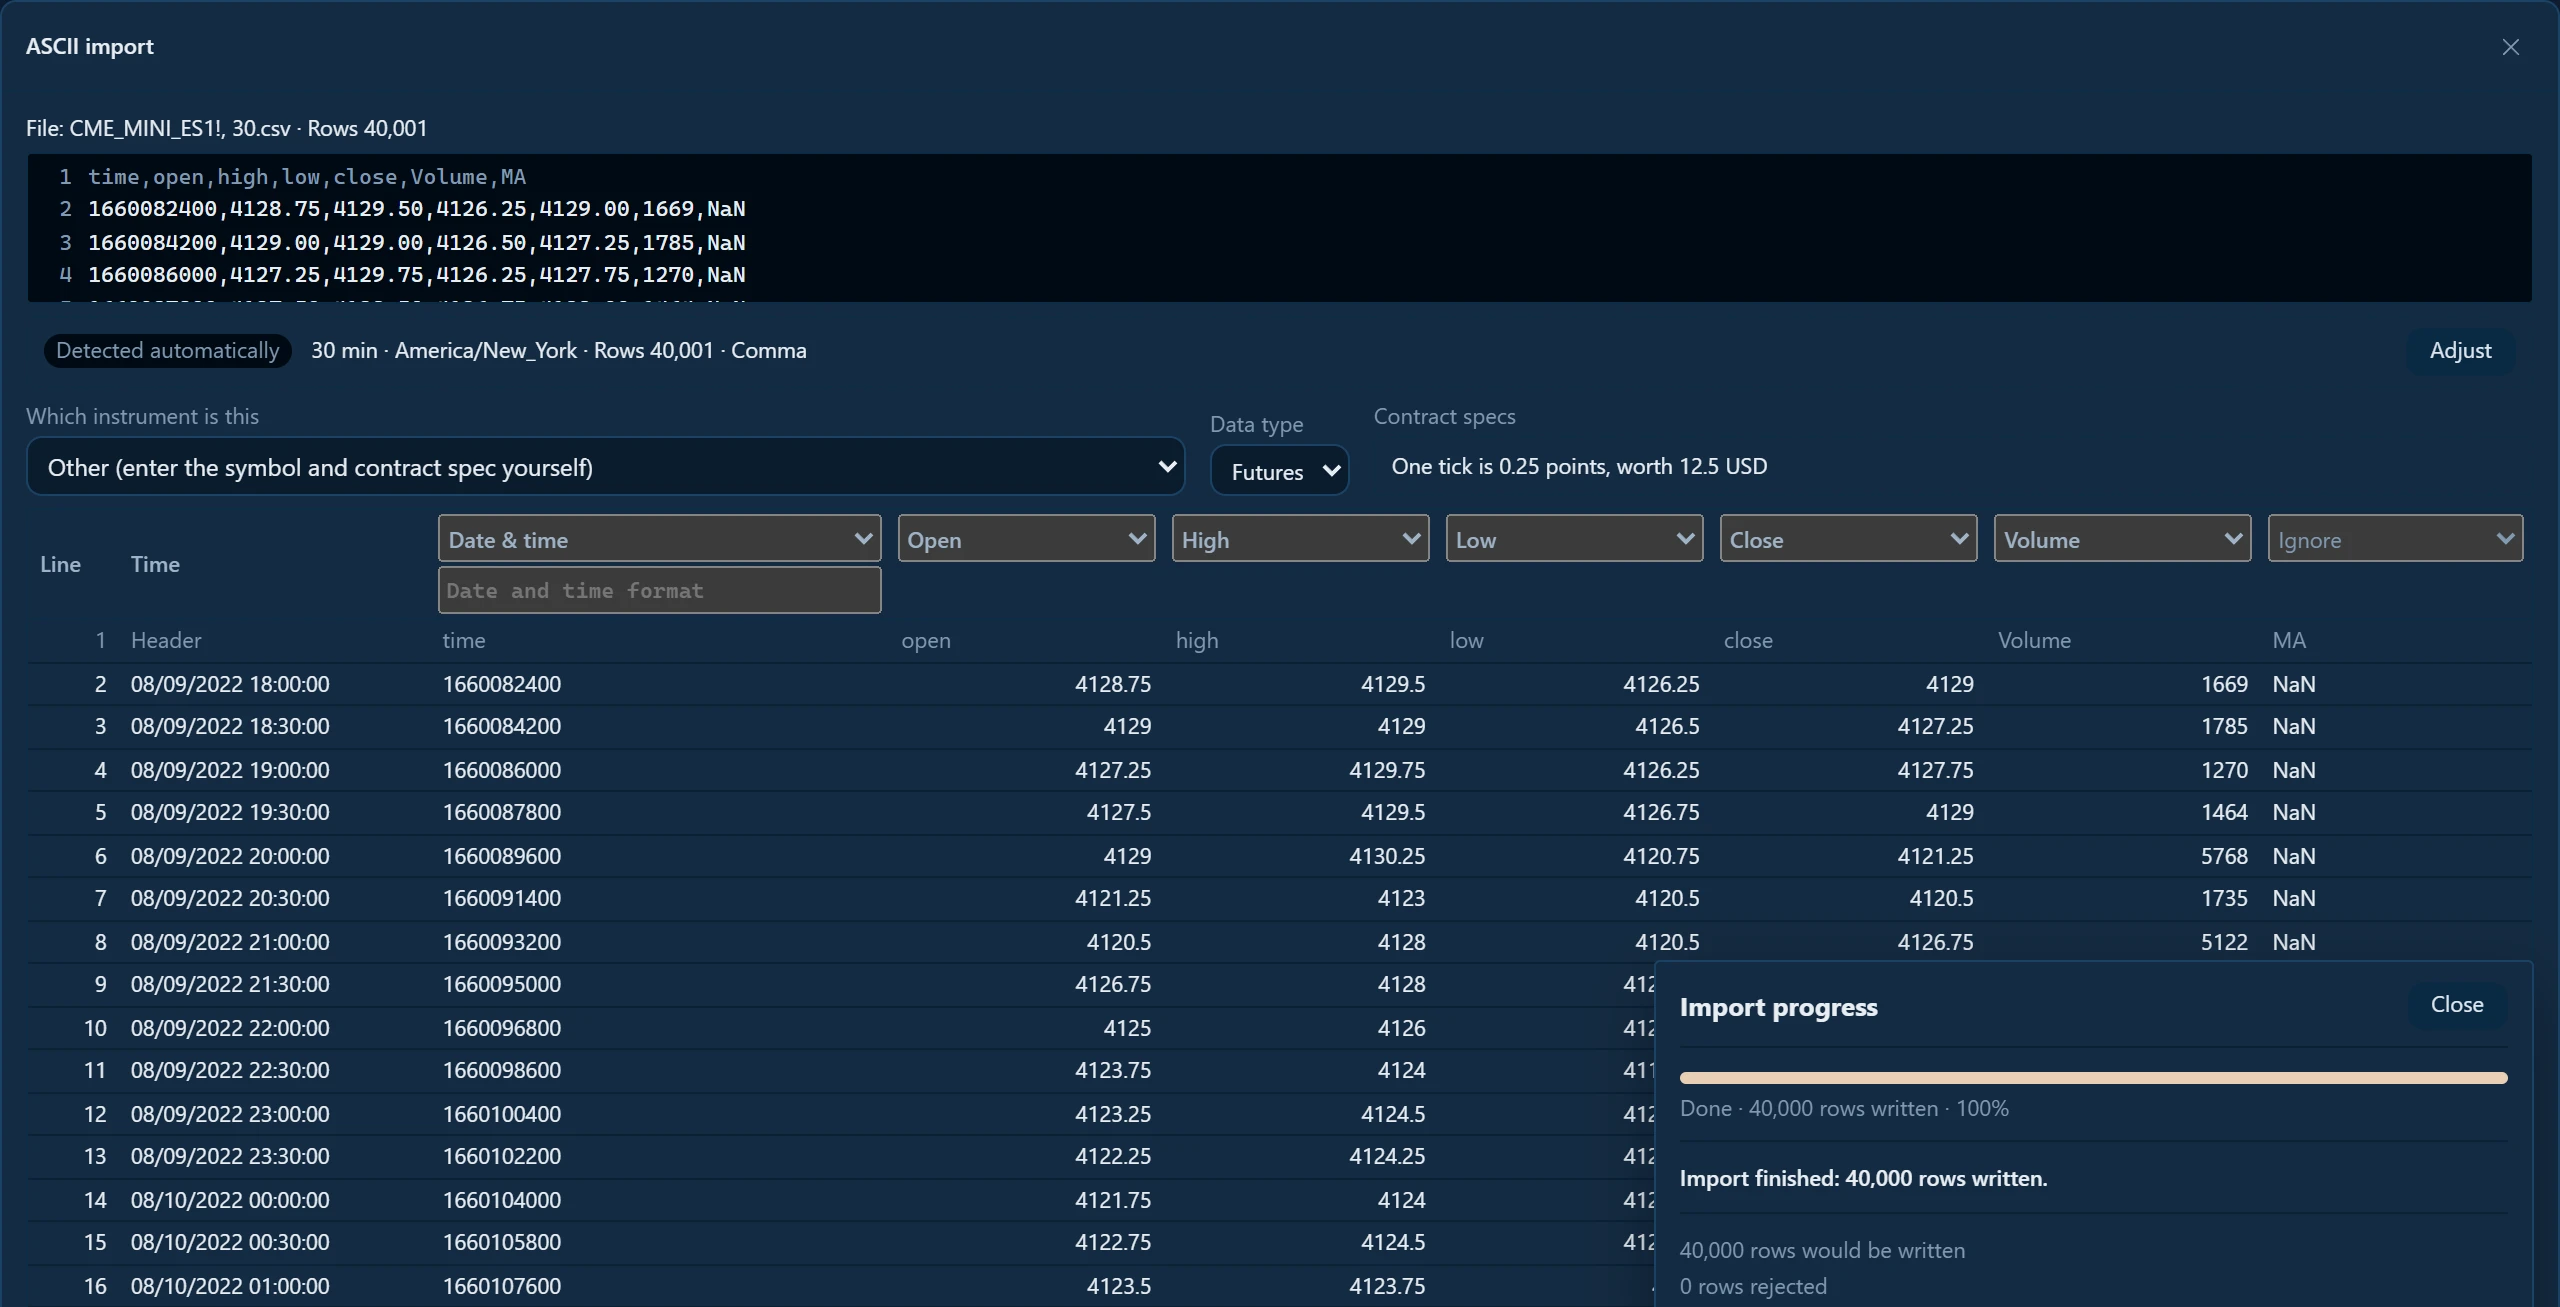
Start Import. The progress panel counts the rows as they are written. The run behind these screenshots is an ES 30-minute file in TradingView's export format:
Our import run · AlphaPrime ASCII import · ES 30 min · 2022-08-09 to 2025-12-30 · run on 2026-11-02
40,000 bars written, 0 rows rejected. Symbol ES, exchange CME, 30 min, bars from 2022-08-09 to 2025-12-30.
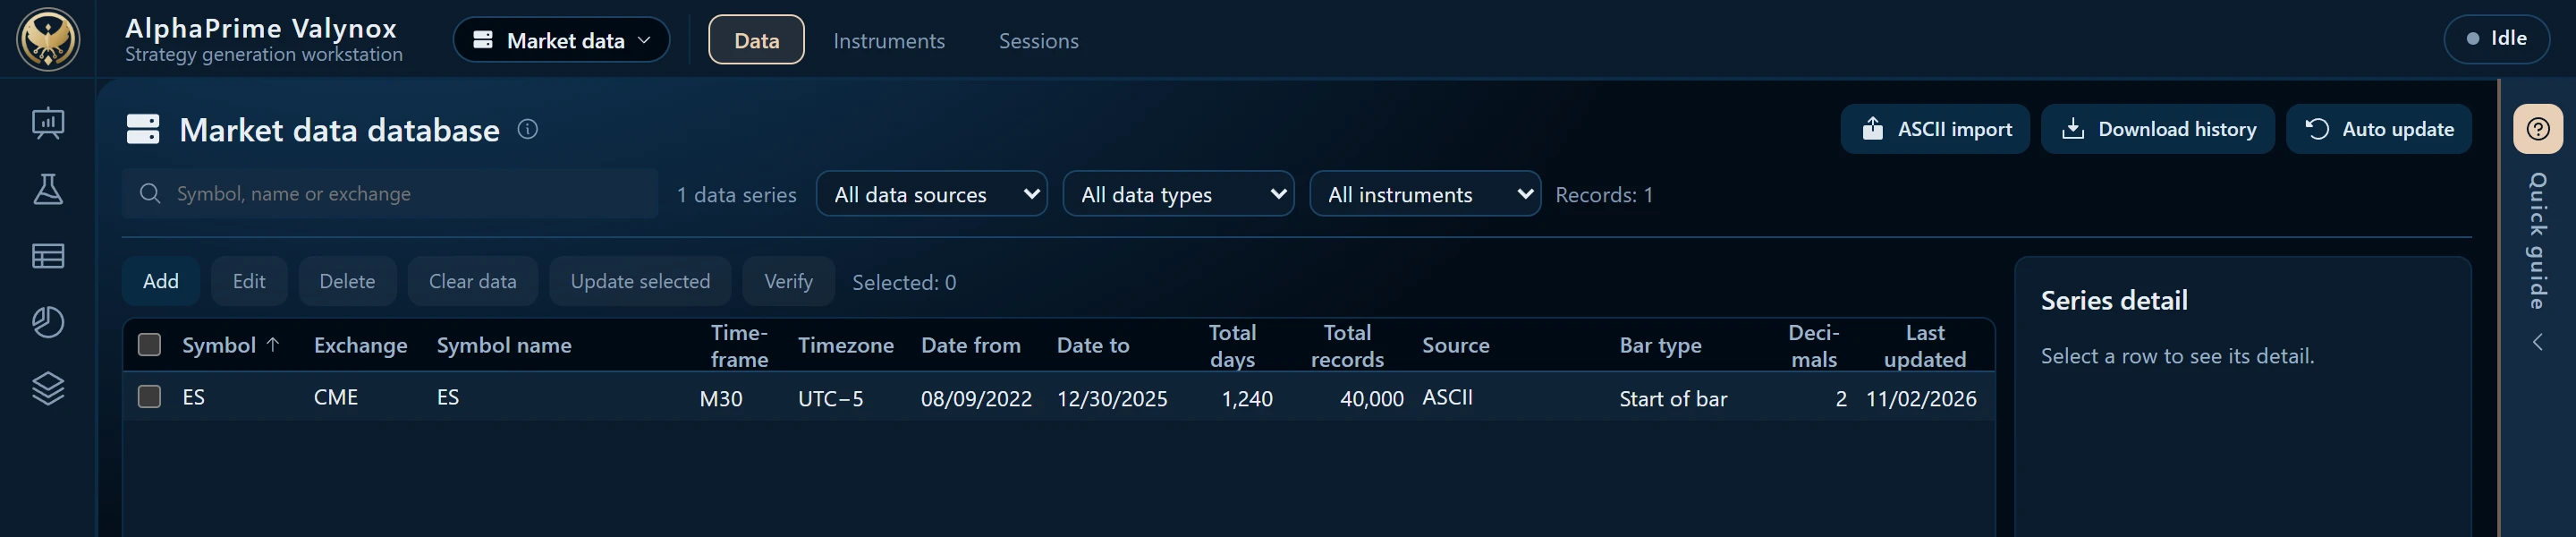
Close the dialog and the series is in the list as ES on CME at M30, 08/09/2022 to 12/30/2025, 40,000 records, source ASCII.
How do you start generating on the imported series?
Open Generation Settings, go to Market Data, and choose the imported series as the market; the timeframe comes up as the file's own, 30 min for the ES file. Start the run. From here the file is market data like any other series in the library, and the strategy generation page shows what a run searches through and how it scores the candidates. To generate on another timeframe, export that chart too and import it as a second series.
The ES contract behind the example, its hours and its tick, is covered in S&P 500 futures explained: ES vs MES, hours and backtest setup, and if backtesting itself is new, what backtesting is: rules replayed on old prices, costs in is the page to start from.
How do you bring in newer bars later?
Export again and import onto the same series. A month from now, export the same chart the same way and run ASCII Import on the new file. Rows whose time already exists in the series are replaced by the row from the new file, and the bars after the old end are added.
Export the chart you already trade from, at the timeframe you read it on, and run the import once.
Frequently asked questions
UNIX timestamp or ISO time: which export format should I choose?
Either one. AlphaPrime reads both and takes the time column as the date-time column; the format is detected. A UNIX timestamp is a count of seconds, which the preview grid shows converted into the exchange's time zone; ISO time shows the date and time as text.
What happens to the indicator columns in the file?
They are set to Ignore. A chart with a moving average on it exports one extra column per indicator, the import dialog shows each of them, and the bars are written from time, open, high, low, close and Volume.
Do forex and crypto exports import the same way?
Yes. A file named FX_EURUSD, 60.csv is set to Forex, a file named BINANCE_BTCUSDT, 240.csv to Crypto, and the time column, bar size and price columns are read the same way as for ES. The part you type is the contract spec: price scale, minimum movement, big point value and currency, with the values your broker or exchange uses.
Can I generate on two timeframes of the same symbol?
Yes. Export the chart at each timeframe, import each file as its own series, and Generation Settings shows each series at its own timeframe. The file name carries the bar size, 30 for 30 minutes, 60 for 1 hour, 240 for 4 hours, so the two files stay distinct.