

From generated strategy to MultiCharts: a PowerLanguage comparison checklist
After exporting a strategy to PowerLanguage, compare its trades in MultiCharts with the research backtest. When they differ, the cause is usually one of a few settings. Check them before you trust either result.
AlphaPrime team ·
Why compare
Strategy research usually happens in one tool and trading in another. If the trading platform does not reproduce the research backtest, you do not know which result describes the strategy you are about to run. Comparing the two trade lists on the same data is the first thing to do after exporting a strategy.
PowerLanguage is the scripting language of MultiCharts and is closely related to TradeStation's EasyLanguage. A generated strategy exported as PowerLanguage is compiled and run in MultiCharts like any hand-written signal.
The checklist
1. Same data
- Same symbol and contract roll method (continuous futures can be back-adjusted in different ways).
- Same date range, including the first bars used to warm up indicators.
- Same bar construction. A 37-minute bar from one source may not start at the same minute as a 37-minute bar built by the platform.
2. Same sessions and time zone
- Check the session template the chart uses. Regular-hours and full-session data produce different bars and different indicator values.
- Check whether timestamps mark the open or the close of each bar, and which time zone the platform displays and calculates in.
3. Same execution timing
- Decide whether orders are generated on bar close and filled on the next bar's open, or filled within the bar. In MultiCharts, intra-bar order generation changes this behavior, so make sure the setting matches the research assumption.
- Stop and limit orders that would fill inside a bar depend on assumptions about price movement within the bar. Different tools can make different assumptions, so check those trades first.
4. Same costs
- Enter the same commission and slippage per contract in the strategy properties. A mismatch here changes net results without changing trades, which makes it easy to spot. See trading costs in backtests.
5. Bars back and warm-up
- The platform needs enough history before the first trade to calculate every indicator (in MultiCharts, the maximum number of bars a study will reference). If this is set too low or too high compared with the research tool, the first trades will differ.
6. Price rounding and contract size
- Order prices should be rounded to the instrument's tick size the same way in both tools.
- Check the point value and the number of contracts per trade.
How to compare
- Export both trade lists with entry time, exit time, direction and prices.
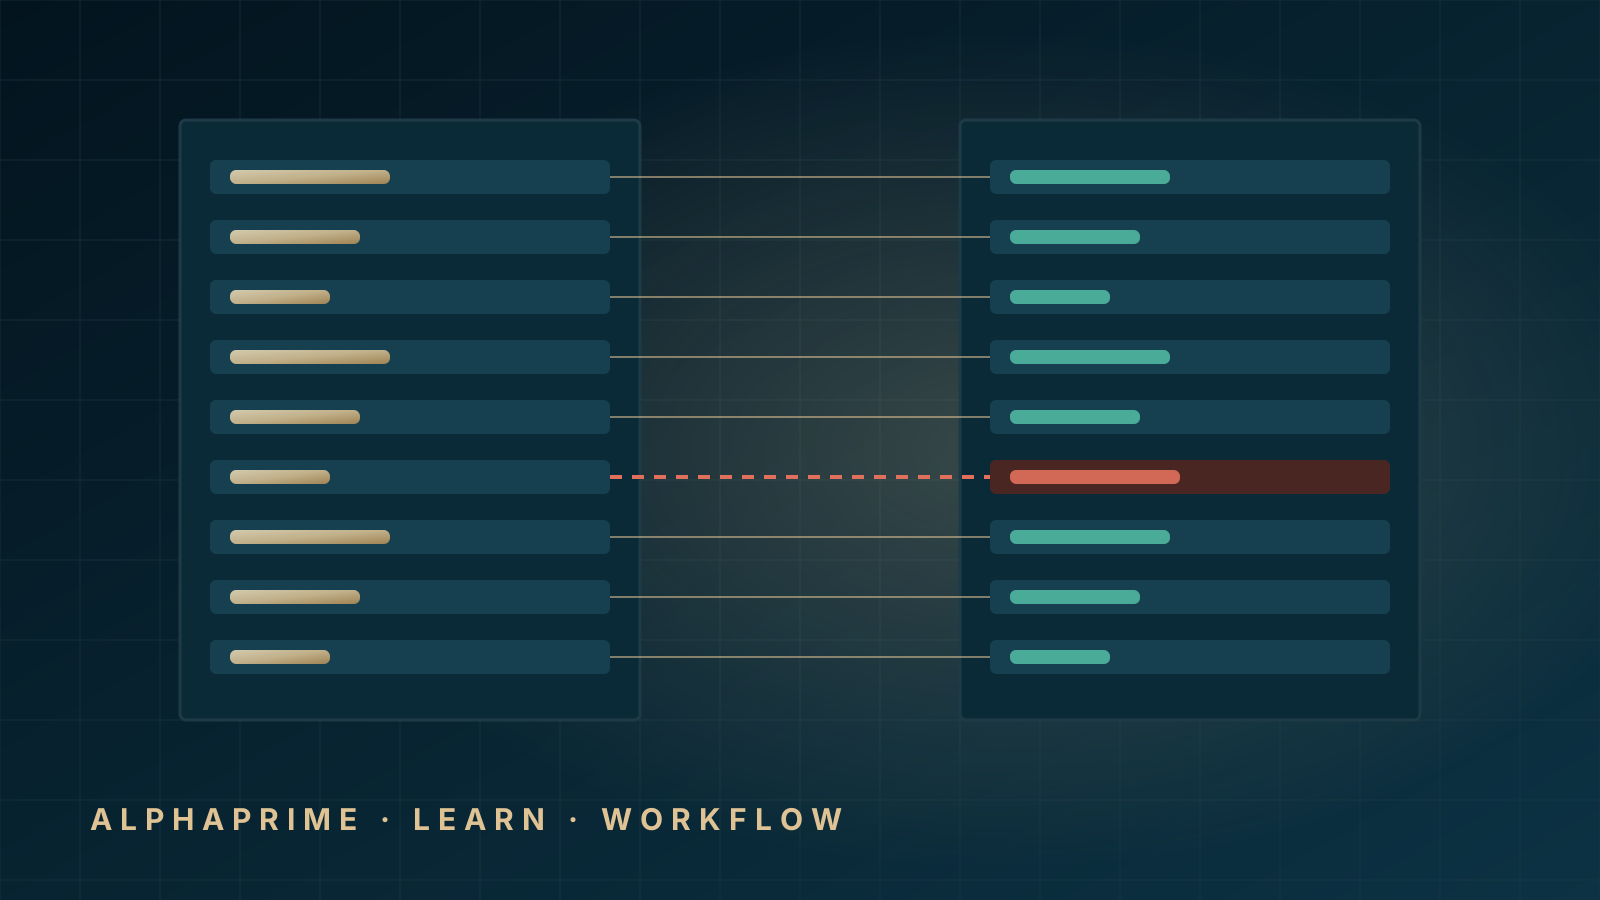
- Compare them trade by trade, starting from the first one. The first difference usually points to the cause: warm-up, session or execution timing.
- Fix one setting at a time and rerun.
- Keep the matching settings as the strategy's documented trading configuration.
Small differences can remain for legitimate reasons, such as different intra-bar fill assumptions. Write down what differs and why, so you know which result to use when deciding position size.
What AlphaPrime does here
AlphaPrime's platform export is designed to take research results into your trading workflow. It exports PowerLanguage for MultiCharts; Pine Script (TradingView) export is a Beta feature of the full version. Formats and limitations are published with each release.