Your strategy library,
from first filter to strategy portfolio.
Every strategy that is kept is in the Strategy databank at the bottom. Double-click a strategy in the Strategy databank to open it in the Performance Report.
Search and sort
Search by strategy name or symbol; click a column header to sort.
Manage columns
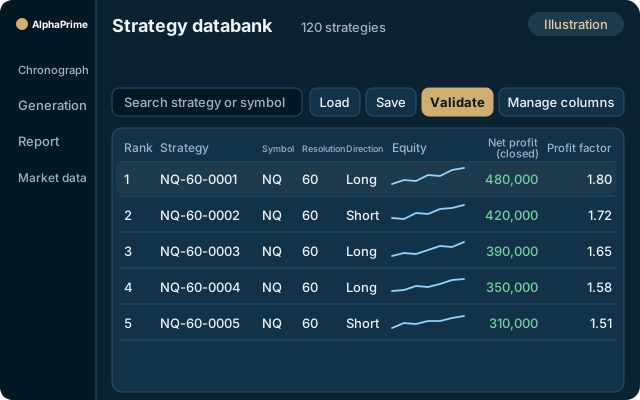
The strategy list, equity curves and performance columns put your research results in one place; choose which columns to show under “Manage columns”.
Batch actions
Check several strategies and save them as .apx files or delete them in one go; you can also load strategies from .apx files.
Revalidate
Check strategies and click “Validate” to run the methods turned on in “Strategy Validation”; the results are saved with the strategy in the databank, so you can revalidate at any time.
How strategies qualify for the databank
A strategy must pass Filter & keep and the queued validation steps before it can enter the Strategy databank; all other strategies are discarded during the run. In the ES 60-minute run on 2026-10-15, for example, 1,024 strategies were evaluated and 250 passed the basic filters.
Correlation filtering then acts as the gatekeeper: a new strategy must have a correlation below 0.3 with the strategies already kept. This default affects the quality of the Strategy databank more than any ranking column; without it, the list fills with near-identical variants of the same idea.
Strategies can also be loaded from .apx files, whether from another computer or from a research partner.
Finding the strategies worth reviewing
- Search by strategy name or instrument, for example ES or NQ.
- Click a column header to sort; choose the displayed columns under Manage columns.
- Double-click a strategy to open it in the Performance report.
- Select several strategies and press Validate to rerun the methods enabled in Strategy validation; the results are saved with each strategy.
- Selected strategies can be saved as .apx files or deleted in batches.
Sorting is the most common source of misjudgment: the top strategy by net profit is often the most severely overfitted one. Sorting by net profit / max drawdown is recommended instead, and strategies whose logic cannot be explained in one sentence should be deleted.
From the Strategy databank to a strategy portfolio
Portfolio Power is located in the left sidebar. Add strategies from the Strategy databank or remove them, and the combined results update immediately: net profit, max drawdown (calculated from daily mark-to-market values), net profit / max drawdown, Sharpe ratio, combined equity curve and average monthly correlation.
A low average correlation is not sufficient on its own as a basis for judgment. The figure is calculated daily, and most trading days are calm. Two trend strategies on ES and NQ may appear unrelated for months, yet lose in the same week, because their underlying indices are highly correlated. Before relying on a low correlation figure, check whether each strategy's largest losing periods are concentrated in the same weeks.
For the same concept implemented in a spreadsheet, see How to backtest a portfolio of strategies.
Run one generation in the free 7-day trial, sort the Strategy databank by net profit / max drawdown, and delete the strategies whose logic cannot be explained.
Strategy databank
Strategy databank: the strategy list, equity trends and performance columns.
Free 7-day trial