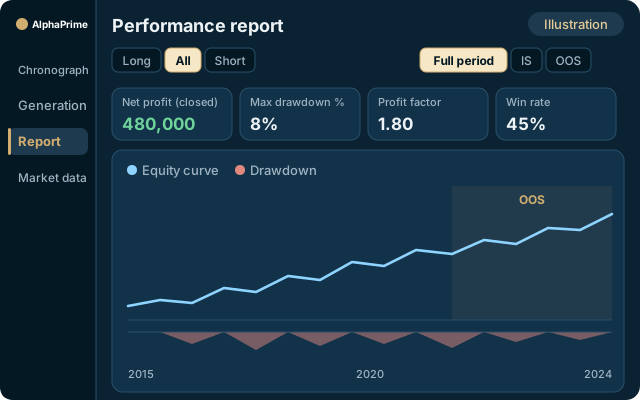
A backtest report built for one question:
was this strategy just lucky?
Double-click a strategy in the Strategy databank to open it in the Performance Report: equity, drawdown, periodical performance, long/short analysis and trades are all here.
Equity curve and drawdown
Switch the sample to OOS and see whether the out-of-sample stretch holds up.
Long/short analysis
Long, Short and All, viewed separately.
Periodical performance
Periodical Analysis and the monthly return heat map show how each month and each year performed.
Trades
Whether every entry, exit and cost makes sense.
Strategy source
Which conditions and parameters this strategy actually uses.
The order for reading a backtest report
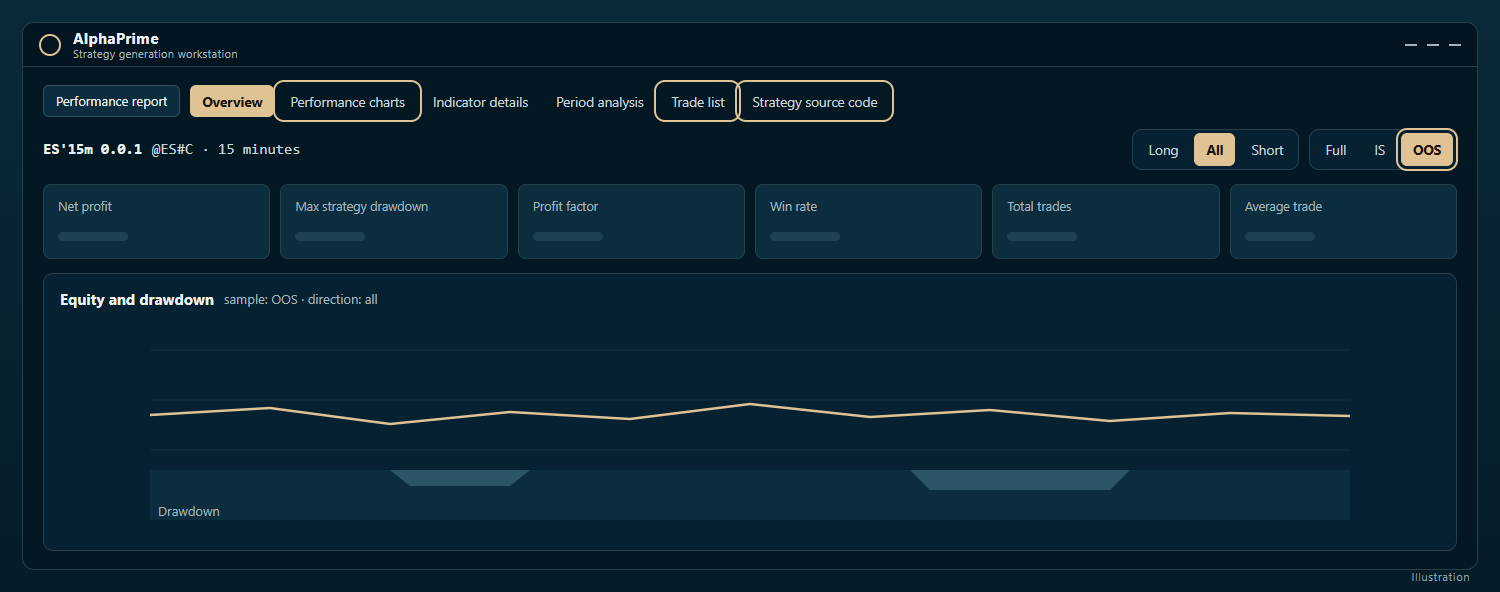
The first thing to check is not net profit but OOS at the top right. The report can switch between Full, IS and OOS, and between Long, All and Short. OOS is the historical segment never used during the strategy search; if the equity curve flattens or declines from the start of OOS, the other metrics lose much of their value.
Next come the six metrics at the top: net profit, max strategy drawdown, profit factor, win rate, total trades and average trade.
Average trade is the most often overlooked metric, yet it requires the closest scrutiny. One ES tick is worth 12.5 US dollars; a strategy with an average profit of 30 US dollars per trade has a margin of only about two and a half ticks, which actual slippage slightly above the configured value can erase entirely.
Total trades is equally critical. With fewer than 100 trades, the statistics are of limited value; adding or removing a few trades can change the figures substantially.
Reading the equity curve
The upper part of the chart shows equity and the lower part shows drawdown. Beyond the depth of a drawdown, also review its duration. A strategy that goes as long as a year without a new high is difficult to keep running in practice, even if its maximum drawdown is small.
Switch between the Long and Short views. Many strategies that appear balanced between long and short actually profit on one side and lose on the other.
Period analysis provides a monthly return heat map. If the profit is concentrated in just two months, the strategy applies only to those two months.
Distinguishing skill from luck
A single backtest report cannot prove that a strategy is not the result of luck, but it can bring the evidence together: IS and OOS side by side, the trade list, and the validation results saved with the strategy.
Measured reference: ES 60-minute bars, 2026-10-15, RTX 3060 Ti. Of the strategies that passed walk-forward analysis, 91% were profitable on held-out data; of those that did not, 53%. This gap is the key point to confirm when reviewing your own reports.
- Trade list: check entries, exits and costs trade by trade. A fill at a price the bar never traded indicates an error in the data or session settings.
- Strategy source code tab: the conditions and parameters the strategy actually uses. Seven conditions behind 120 trades should raise caution.
Open the first generated strategy in the free 7-day trial, switch to OOS first, and review its performance.
Performance report
Performance report: equity curve and drawdown, switchable between long and short and between IS and OOS.
Free 7-day trial