

Trading costs in backtests: commission, slippage and the average trade
Many strategies that look good in a backtest have an edge per trade smaller than the cost of taking the trade. Put costs in from the first run and compare them with the average trade.
AlphaPrime team ·
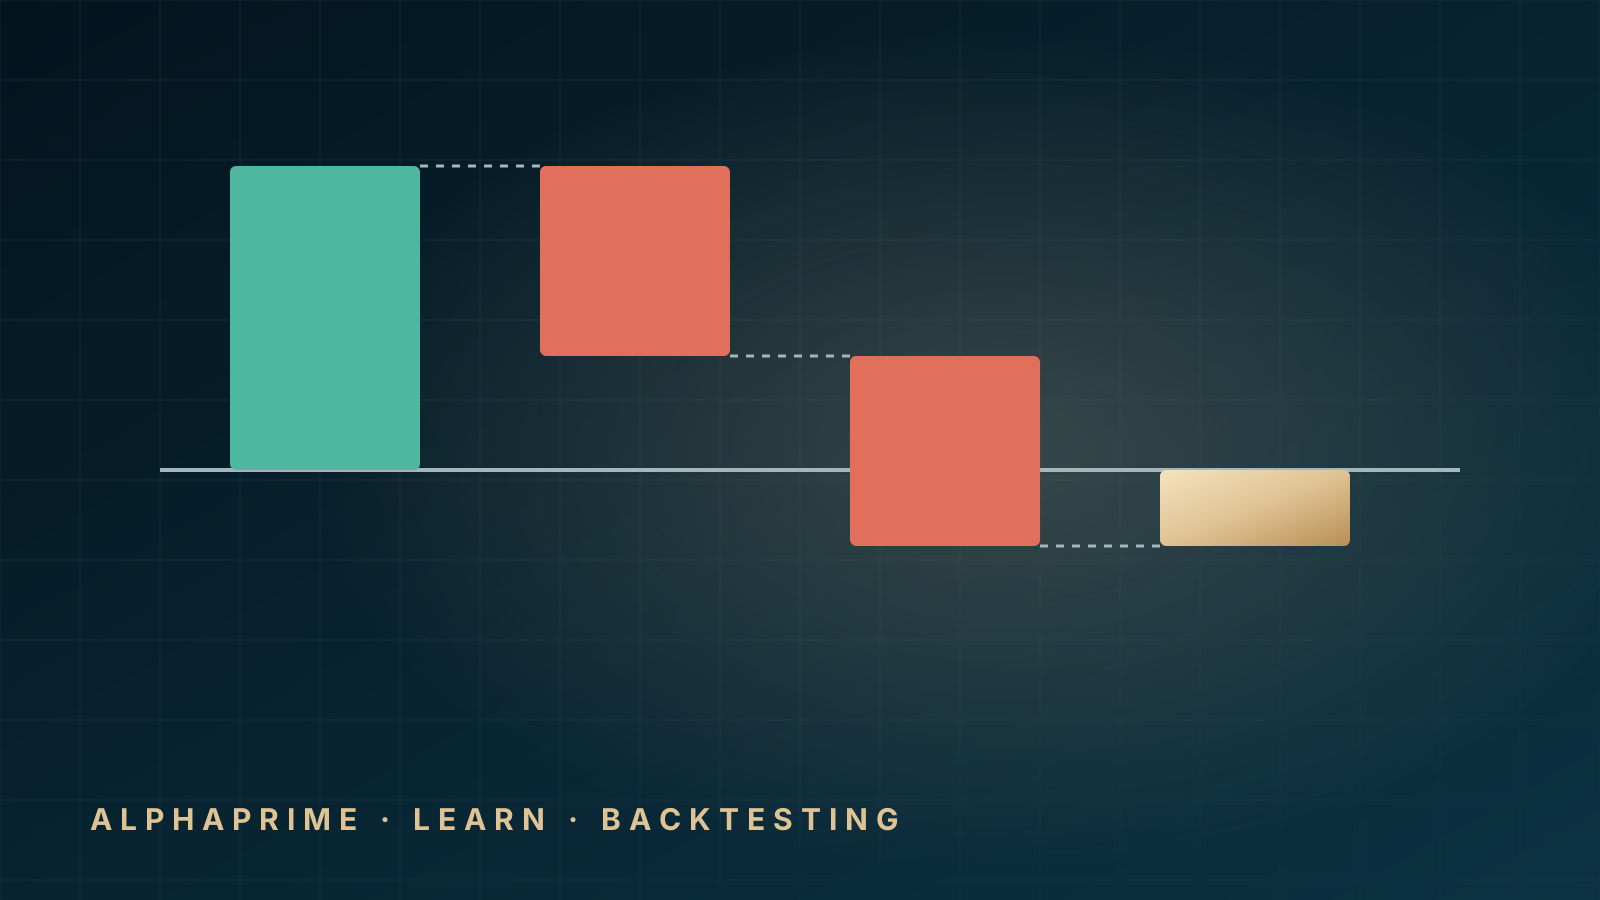
The cost most backtests underestimate
A backtest without costs measures the price movement a strategy captured. A real account pays for every entry and exit. The difference is small per trade and large per year, and it grows with the number of trades.
The usual result: strategies that trade often look the best before costs and the worst after them, because they have the smallest move per trade and the most trades.
What to include
- Commission and exchange fees, charged per contract or share, on both entry and exit. For futures, add exchange, clearing and regulatory fees to the broker's commission.
- Slippage, the difference between the price the backtest assumed and the price you would actually get. Market orders and stop orders usually fill worse than the trigger price, especially around news and at the open.
- Spread, if your data uses mid or last prices but you would trade at the bid or ask.
- Financing or rollover costs for positions held across sessions, where relevant.
Model costs per round trip (entry plus exit) and in the same units as the backtest results, so you can compare them directly.
The average trade test
The simplest useful check: compare the average trade before costs with the round-trip cost.
A hypothetical example. A strategy on a micro index future shows a gross result of $16,000 over 10,000 trades. That is $1.60 per trade. If commission and fees are $1.00 per round trip and average slippage is one tick worth $0.50 on each side, the round-trip cost is $2.00. The strategy loses about $0.40 per trade after costs, even though the gross backtest looked strong.
| Per trade | 10,000 trades | |
|---|---|---|
| Gross result | $1.60 | $16,000 |
| Commission and fees | −$1.00 | −$10,000 |
| Slippage (one tick each side) | −$1.00 | −$10,000 |
| Net result | −$0.40 | −$4,000 |
A common rule of thumb is that the gross average trade should be several times the round-trip cost, so that a modest increase in slippage does not wipe out the edge. How many times is a judgment call that depends on how reliable your cost estimate is.
Estimating slippage honestly
- Use your own fills if you have live history. Compare fill prices with the signal prices the backtest would have used.
- Without live history, start with at least one tick per side for liquid futures with market or stop orders, more for less liquid contracts and for entries at volatile times.
- Stress test: rerun the backtest with double the slippage. If the strategy fails, it was depending on cheap execution.
- Limit orders reduce slippage but may not fill. A backtest that assumes every limit order fills when price touches it is optimistic.
Execution assumptions matter too
Costs are not only fees. A backtest that decides on the close of a bar and also fills on that same close is using a price it could not have traded at. Executing on the next bar (sometimes called N+1 execution) is more realistic for strategies that decide at the bar close.
Include costs during the search, not after
If a strategy generator ranks candidates without costs, it will favor strategies with many small trades, because they look smoothest. Adding costs at the end then eliminates most of the finalists, and the search time was wasted. Put realistic costs into the search settings from the first run, so the ranking already reflects what you could trade. This also reduces overfitting, because noise-driven high-frequency patterns are the ones costs remove first.
What AlphaPrime does here
AlphaPrime's GPU backtesting research scope covers fees and slippage, N+1 execution and trading sessions, so costs and execution timing are part of the search rather than an afterthought. The performance report shows equity, drawdown and individual trades.