

Walk-forward analysis: why one backtest is not enough
A single backtest tells you how a strategy fit the past. Walk-forward analysis asks a harder question: would the way you build and tune it have held up on data it had not seen yet?
AlphaPrime team ·
The problem with one backtest
A backtest runs a set of rules over historical data and reports what would have happened. If you chose those rules or their parameters by looking at the same data, the result is partly a measure of how well you fitted that data. The better the fit, the less the number tells you about the next year.
This is not a flaw in backtesting. It is a limit on what one backtest can answer. To learn whether a strategy-building process holds up, you need to test it on data the process did not use.
What walk-forward analysis does
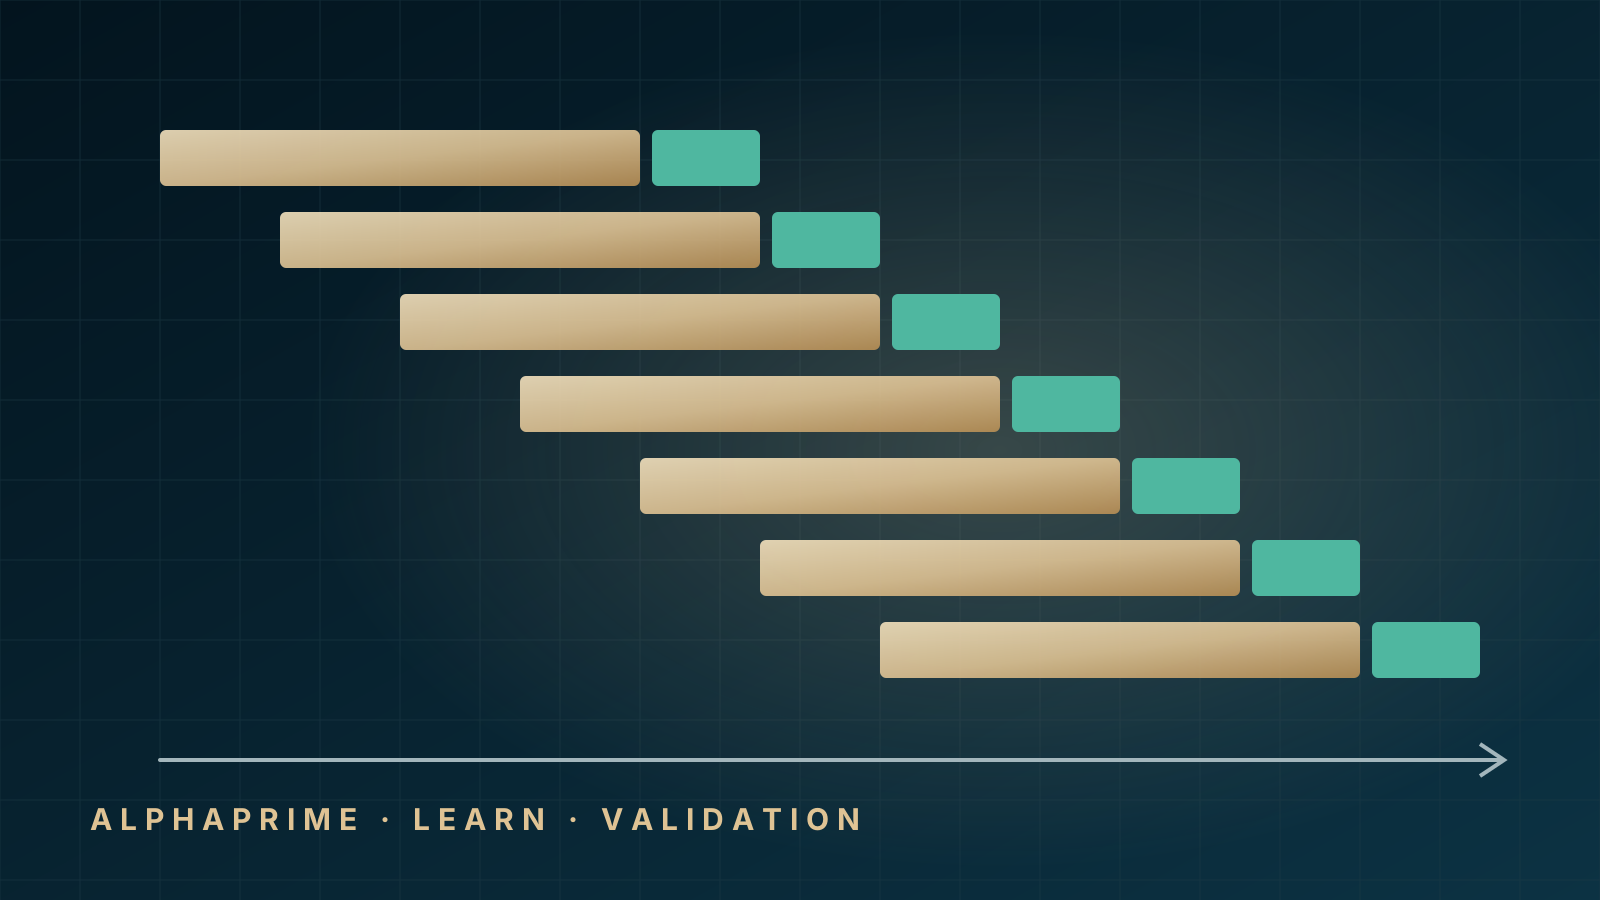
Walk-forward analysis repeats a simple cycle across the history:
- Optimize the strategy's parameters on a window of data (the in-sample window).
- Test the chosen parameters on the window that immediately follows (the out-of-sample window), without changing anything.
- Move forward by the length of the out-of-sample window and repeat.
At the end you join the out-of-sample segments into one equity curve. Every trade on that curve was taken with parameters chosen before the trade's data existed in the optimization. That is much closer to how you would actually run the strategy: re-tune periodically, then trade forward.
Choosing the windows
There is no universal setting, but a few rules of thumb hold up:
- In-sample long enough to contain enough trades. A window that produces a handful of trades gives the optimizer noise to fit. Many traders aim for at least 30 to 50 trades per in-sample window, more for strategies with many parameters.
- Out-of-sample short relative to in-sample. Ratios between 3:1 and 5:1 (in-sample to out-of-sample) are common. Shorter out-of-sample windows mean more re-optimizations and a more realistic simulation of periodic re-tuning.
- Anchored or rolling. A rolling window drops the oldest data as it moves; an anchored window always starts at the beginning. Rolling adapts faster to changing markets; anchored uses more data. Try both if you are unsure which suits the strategy.
- Cover different market conditions. The full history should include trending, ranging, high-volatility and low-volatility periods, so that the out-of-sample segments are not all drawn from one regime.
How to read the results
The joined out-of-sample curve is the headline result, but look at more than its end value:
- Walk-forward efficiency. Compare the out-of-sample performance rate with the in-sample rate (for example, annualized net result per window). If out-of-sample keeps only a small fraction of in-sample performance, the optimization is mostly fitting noise.
- Consistency across windows. A curve that comes from one or two lucky windows is fragile. Count how many out-of-sample windows were positive and how large the worst window was.
- Parameter stability. If the optimizer picks wildly different parameters from one window to the next, the strategy has no stable edge in that parameter space. Neighbouring windows choosing similar values is a good sign.
- Costs included. Walk-forward results without commission and slippage can look far better than reality, especially for strategies that trade often. See how to include trading costs.
A walk-forward matrix
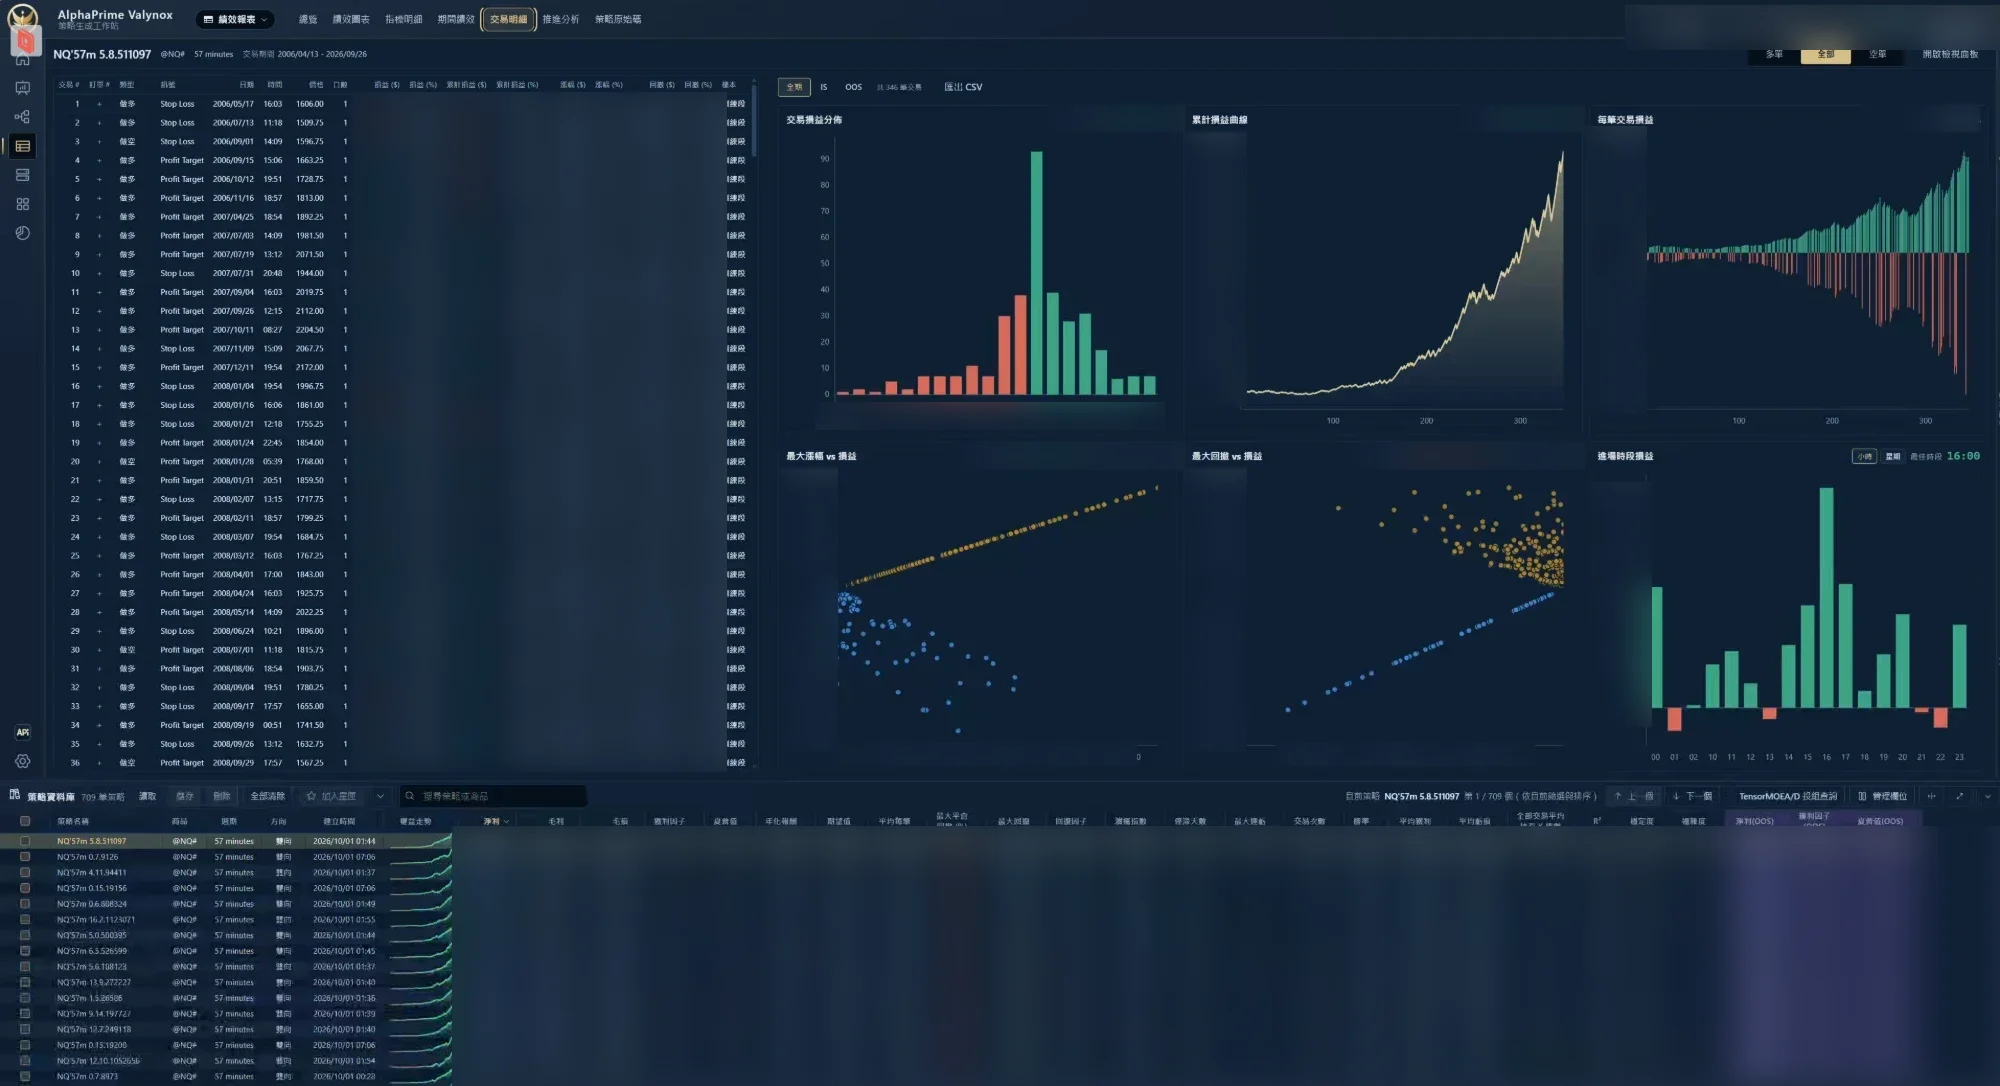
Because the window lengths are themselves choices, it helps to run the analysis with several combinations, for example in-sample lengths of 2, 3 and 4 years against out-of-sample lengths of 3, 6 and 12 months. If the strategy only survives one specific combination, treat the result with suspicion. If most combinations give similar out-of-sample behavior, the result is more trustworthy.
What walk-forward analysis cannot do
- It cannot fix a biased process. If you ran hundreds of walk-forward tests and kept the best one, you have optimized the walk-forward itself. See overfitting in strategy generation.
- It does not prove the future will resemble the past. It shows whether a re-tuning process worked across the history you have.
- It is expensive. Every window is a full optimization. A matrix of 9 combinations over 15 years can mean hundreds of optimization runs, which is where compute starts to limit how thoroughly you can test.
What AlphaPrime does here
AlphaPrime's strategy validation includes walk-forward analysis and custom thresholds that stop later checks when a strategy fails an earlier one. Walk-forward analysis is included in the free trial, the CPU edition and the GPU edition, and runs on NVIDIA graphics cards.