

Market profile: value area, POC and what an ES test shows
Market profile draws one session as a distribution of time at each price. Its point of control and value area are descriptive levels, not signals: they only become testable once written as exact entry, exit and session rules and run after costs, which is also where most of the support for them stops.
By Soren Huang · Published · updated · Editorial policy
Contents
- What is market profile?
- What are TPO, value area and point of control?
- Does market profile work? What the evidence can and cannot show
- How do you read ES market profile levels: value area high, low and POC?
- What does a backtest of POC rules on ES show?
- Where can you find a market profile study guide?
- Frequently asked questions
- References
What is market profile?
Market profile is a way of charting one trading session so that the time spent at each price forms a distribution. Its two outputs, the point of control (the price with the most time) and the value area (the band holding about 70 percent of the session), become testable only when written as exact entry and exit rules.
A normal bar chart puts time on the horizontal axis and price on the vertical axis, so a session is a row of bars read left to right. A market profile keeps the price axis and throws the time order away. Each half hour of the session gets a letter, and the letter is written next to every price that traded during that half hour. Prices the market visited many times collect many letters and form a wide row; prices it only passed through form a thin row. The result looks like a bell curve turned on its side, with a bulge where the market spent most of its time. The method was developed for Chicago Board of Trade futures in the 1980s, when a trader on the floor could feel where the crowd was comfortable but had no way to draw it.
Traders use the profile to answer one question: where did the market agree on price today, and where did it refuse to stay? The bulge is the agreement. The thin tails are the refusals. This is a useful description, and that is the point this article keeps returning to: a description is not a signal. A profile tells you where yesterday's agreement was. It does not tell you whether to buy at that price today, and nothing in the drawing becomes a tradeable rule until you write down an entry price, an exit price and the session you measure on.
What are TPO, value area and point of control?
A TPO is one 30-minute block of time at one price, the point of control is the price with the most TPOs, and the value area is the band of prices around it that holds about 70 percent of the session's TPOs, built in a fixed order of steps. TPO stands for time price opportunity. If the market traded at 5,000.00 during the first half hour, the price row 5,000.00 receives the letter A. If it also traded there in the fourth half hour, the row receives a D as well. One letter at one price is one TPO.
The point of control (POC) is the price row with the highest TPO count, which is the price where the session spent the most time. When two rows tie, most charting programs take the one nearer the middle of the session's range. The value area is the group of price rows, including the POC, that together hold about 70 percent of all the TPOs in the session. Its top row is the value area high (VAH) and its bottom row is the value area low (VAL). Seventy percent is a convention; it is roughly the share of a bell curve that lies within one standard deviation of the middle, and it has been the standard setting since the method was first drawn.
- Count the TPOs at every price row for the session you have chosen. Write the count next to each row.
- Find the row with the most TPOs. That row is the POC and the value area starts there.
- Look at the row just above the band and the row just below it. Add whichever holds more TPOs to the band. (Some programs compare two rows above against two rows below at each step; the result is usually the same or one row different.)
- Repeat step 3 until the band holds about 70 percent of the session's TPOs. The top row is the VAH and the bottom row is the VAL.
Hypothetical example
Suppose a session with 13 half-hour periods produced 60 TPOs in total, on price rows one point apart. The row 5,000 has 9 TPOs, the most, so it is the POC. Above it, 5,001 has 8, 5,002 has 6, 5,003 has 4 and 5,004 has 2. Below it, 4,999 has 7, 4,998 has 5, 4,997 has 3 and 4,996 has 1. The remaining TPOs sit in thin rows further out. The target is 70 percent of 60, which is 42. Start at 9. Compare 5,001 (8) with 4,999 (7): add 5,001, total 17. Compare 5,002 (6) with 4,999 (7): add 4,999, total 24. Compare 5,002 (6) with 4,998 (5): add 5,002, total 30. Compare 5,003 (4) with 4,998 (5): add 4,998, total 35. Compare 5,003 (4) with 4,997 (3): add 5,003, total 39. Compare 5,004 (2) with 4,997 (3): add 4,997, total 42. Stop. The value area runs from VAL 4,997 to VAH 5,003 with the POC at 5,000.
Two things in this procedure matter for testing. First, every output depends on which session you count. A profile of the regular session, a profile of the overnight session and a profile of the full 24-hour day give three different POCs for the same date. Second, the levels are only final after the session closes. A rule that uses today's POC while today is still trading is using a number that keeps moving, which is a common form of look-ahead error.
Does market profile work? What the evidence can and cannot show
Market profile is a descriptive chart, not a signal, so the honest answer is that its claims hold up only where they are written as a precise rule and tested after costs, and most published support is examples rather than measured results. A chart annotated with "price returned to the POC" proves that price returned to the POC on that day. It says nothing about the days when it did not, and it says nothing about what a trader who bought below the POC and waited would have paid in slippage, commission and the losing trades in between.
This is the same problem every visual method faces, and the research on chart patterns shows both the problem and the way out. Lo, Mamaysky and Wang (2000) took patterns that analysts had always identified by eye and rewrote them as exact algorithms, which is the only way to count how often they appeared and what followed. Park and Irwin (2007), reviewing decades of studies on technical trading rules, found that results depend heavily on transaction costs and on how many rules were tried before the reported one was chosen. Neither paper is about market profile, but the lesson transfers directly: a claim becomes evidence when it is a rule with an entry, an exit and a cost, and not before. Our guide to which technical analysis tools and indicators you can actually test sorts methods on exactly this line.
| Market profile claim | Can it be an exact rule? | What the test must fix | What a backtest can measure |
|---|---|---|---|
| Price returns to the POC | Yes | Which POC (prior session), how far from it you enter, the exit if it never returns | Per-trade result after costs |
| The value area holds as support or resistance | Yes | Touch distance, confirmation (a close back inside), stop beyond the level | Per-trade result after costs |
| An open outside value leads to a trend day | Yes | Where "outside" starts, how long to hold, exit at session end | Per-trade result after costs |
| The profile shape tells you the day type | No | Day types (normal, trend, neutral) are labels given after the session has finished | Nothing: there is no trade to count |
The last row deserves a plain word. A day type is a name given to the shape of a completed profile: a narrow tall profile is called a normal day, a long thin one a trend day, and so on. These names are useful for describing what happened. They cannot be tested because by the time the shape is known, the session is over. A rule that acts on the shape while it is forming is a different rule, with its own entry time, and must be written out and tested as such. The same logic is why the article on the best indicator for intraday trading finds that most intraday tools only separate from noise once their entry and exit are fixed and costs are charged.
How do you read ES market profile levels: value area high, low and POC?
On ES the three levels from the prior regular session give three rule families, acceptance above or below value, rejection at the value area edge, and return to the POC, and each one needs a session definition, an entry price and an exit before it can be backtested. The most common practice is to build the profile from the previous day's regular trading session, the part of the ES day that overlaps US stock market trading, and to carry its VAH, VAL and POC into the next day as fixed horizontal lines. The current futures market hours by exchange and session tool shows where that session falls in your own time zone; exchanges can change session times, so confirm them on the exchange's contract page before you fix a session in a test.
Acceptance is price trading outside the prior value area and staying there, usually defined as a close of one or more bars beyond the VAH or below the VAL. Rejection is price reaching the VAH or VAL and closing back inside the value area on the same bar or the next one. Return to the POC is price inside the value area drifting back toward the prior POC, which traders read as the market pulling back to yesterday's point of agreement. Each description above already hides choices: how many closes count as acceptance, how far beyond the edge a bar may trade before it is a breakout rather than a rejection, and what happens to a position when the session ends.
| Rule family | Entry | Exit | Session used |
|---|---|---|---|
| Acceptance above or below value | Buy after one full 30-minute bar closes above the prior VAH (sell after a close below the prior VAL) | Flat at session end, or stop at the prior POC | Prior regular session for levels; current regular session for trades |
| Rejection at the value area edge | Sell when a bar touches the prior VAH and closes back inside value (buy the mirror at the VAL) | Target at the prior POC; stop one fixed distance beyond the edge | Same as above |
| Return to the POC | Buy when price is inside value and a fixed distance below the prior POC (sell the mirror above it) | Target at the prior POC; stop at the VAL (or VAH); flat at session end | Same as above |
Notice how close the first family is to a channel breakout. A Donchian channel breakout buys a close above the highest high of the last N bars; the acceptance rule buys a close above the top of yesterday's value area. Both use yesterday's prices to draw a line and today's close to cross it. That similarity is useful: everything known about testing breakout rules, including the need for a session-end exit and a slippage figure that reflects a fill after a fast move, applies here unchanged. The rejection family, by contrast, is a fade, and the step-by-step method in the double bottom chart pattern test shows how a visual reversal idea becomes a rule with a touch distance and a confirmation close.
What does a backtest of POC rules on ES show?
Our AlphaPrime (Valynox) run on ES daily bars from 2019 to mid-2025 used a stand-in N Day rule rather than a true profile rule, kept one candidate out of 1,024 for its return against its drawdown, and its 44 trades and $68,465 drawdown show why a single kept result must go through validation before it means anything. A true profile rule needs 30-minute bars to build the TPO count and a prior-session level to trade against. The run below was made on daily bars, so it could not build a profile; it used an N Day rule built from standard indicators as its only entry and exit, with no stop, no target and no filters. It stands in for the subject rather than being the subject.
Source: AlphaPrime product engine (CPU), run 2026-10-31. ES daily bars, 2019-01-02 to 2025-06-30, long and short, 1 contract, $20 commission and $25 slippage per trade.
| Number | Result |
|---|---|
| Net profit (closed trades) | $95,582.5 |
| Max drawdown | $68,465 |
| Trades | 44 |
| Win rate | 65.91% |
| Profit factor | 2.035 |
| Average trade | $2,172.33 |
| Time in market | 93.14% |
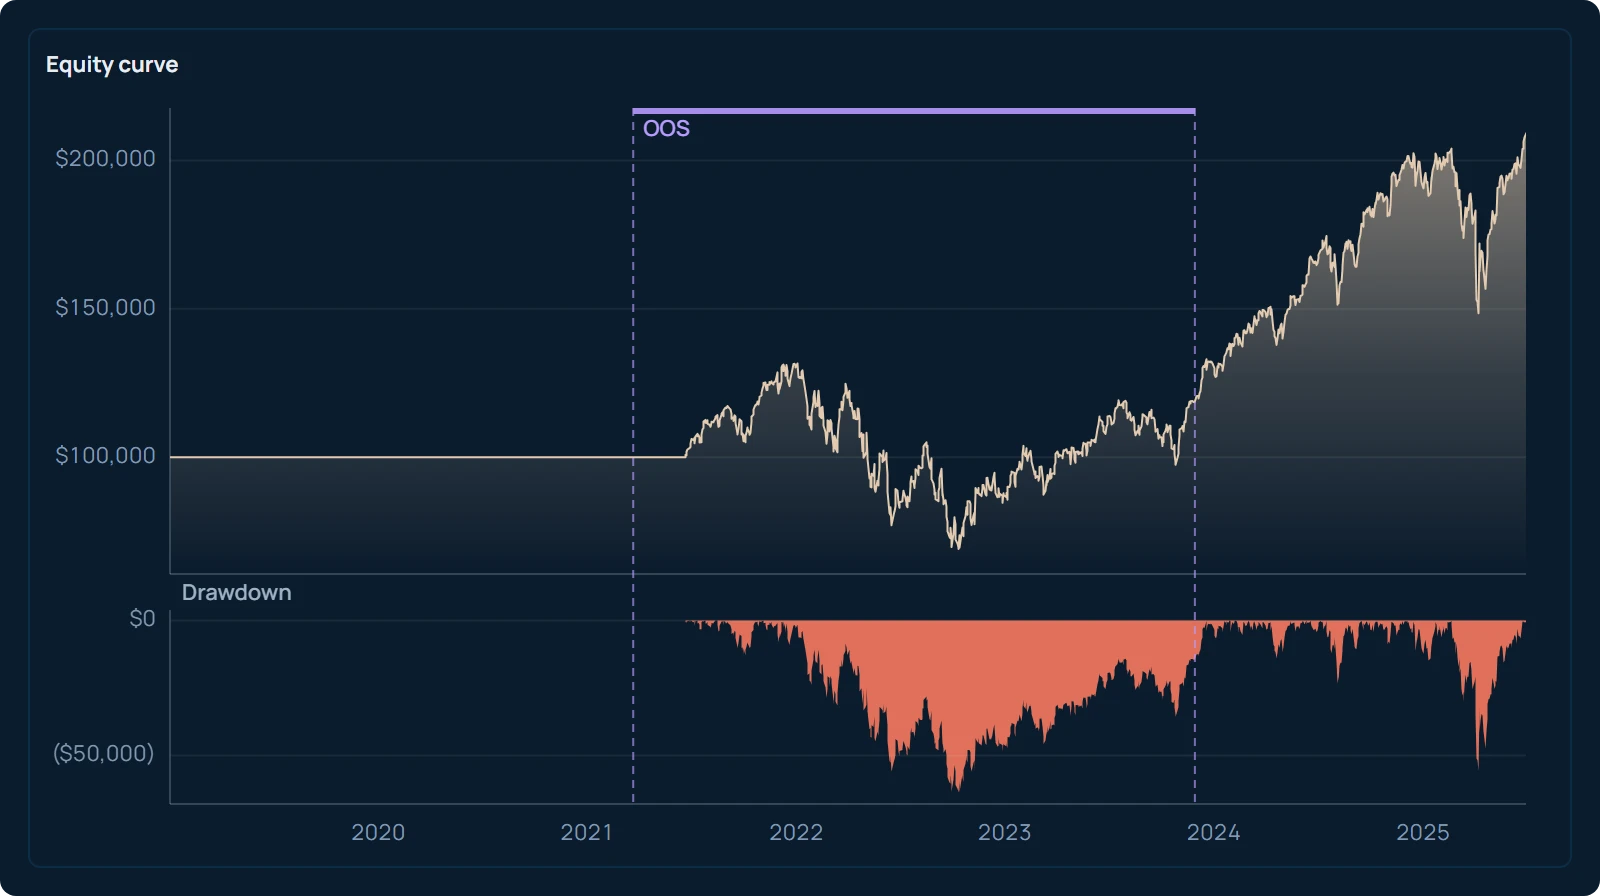
What the run tested: ES daily bars, one contract, long and short, from 2019-01-02 to 2025-06-30, with $20 commission and $25 slippage charged on every trade. AlphaPrime tried 1,024 candidates and kept one for its return measured against its drawdown. That is the first thing to hold onto when reading the table. The candidate was picked after the fact, out of many, because it looked best on this history, and picking the best of many flatters the result. Bailey, Borwein, López de Prado and Zhu (2014) show how quickly the best result in a search drifts away from what the same rule does on new data as the number of tries grows. Nothing in the box says that the N Day rule earned this money or that a reader should expect anything like it.
Three numbers tell you how far this is from a finished strategy. Forty-four trades in six and a half years is a small sample: a change in two or three of them would move the average trade a long way. Time in market of 93.14 percent means the rule was almost always holding a position, so much of the result is simply exposure to ES over a period that includes a long rise, not a timing edge. And a maximum drawdown of $68,465 against a net profit of $95,582.5 means the account spent long stretches well below its previous high, which is the part of a result you actually live through. Any profile-based rule you write will produce a report with the same shape, and it deserves the same reading. In AlphaPrime the kept candidate goes next to strategy validation, where walk-forward analysis and the thresholds you set beforehand decide whether a result like this survives on data the search never saw, and the later checks stop as soon as it fails one.
Where can you find a market profile study guide?
A useful study guide is a six-part path you work through on your own ES data, from building one day's profile by hand to writing one rule and testing it, rather than a document to read once. Reading about profiles teaches the vocabulary. Building twenty of them teaches what the levels actually look like the next morning, and writing one rule from them teaches where the vague parts of the method are. The path below takes a few evenings and leaves you with a tested rule and a reason to keep or drop it.
- Build one day's profile by hand from 30-minute ES bars. Take one regular session, assign a letter to each half hour, write each letter on every price row the bar covered, and count. Output: one profile with POC, VAH and VAL, built the way the previous sections describe.
- Mark POC, VAH and VAL for 20 sessions. Use a charting program for this step, but check two of them against your hand count. Output: a table of 20 dates and three levels each.
- Record where the next session opened relative to value. Above the VAH, inside, or below the VAL, and whether it reached the prior POC during the day. Output: a count of each outcome, which is already a rough answer to "does price return to the POC".
- Write one rule with entry, exit and session. Pick one family from the table above and fix every number: the touch distance, the confirmation, the stop, the session-end exit. Output: a one-paragraph rule anyone could follow without judgment.
- Backtest it with commission and slippage. Use next-bar execution and a slippage figure you can defend for a fast market, then compare the average trade after costs with the round-trip cost. Output: a report read drawdown-first, as in the previous section.
- Run it through validation and keep or drop it. Split the data by date, grade the rule unchanged on the later part, and decide with a threshold you wrote before looking. Output: one decision and a note of why.
If you want to see how a different stacking changes the picture, build one of the twenty sessions as a volume profile, which puts traded volume rather than time at each price; the POC often lands close to the time-based one, and the days where it does not are worth a note in step 3. Then start tonight with step 1: one session of 30-minute ES bars, thirteen letters, a count at each price, and your first hand-built POC to check against the chart tomorrow.
Frequently asked questions
What is market profile in trading?
Market profile is a chart of one trading session that stacks time at each price instead of drawing price against time. Each 30-minute period gets a letter, and the letter is written at every price traded during that period, so prices the market revisited often form wide rows. The widest row is the point of control and the band holding about 70 percent of the letters is the value area. The chart describes where trading was concentrated; it does not by itself give a buy or sell signal.
Does market profile work?
As a description of where a session spent its time, it works by definition. As a trading method, the question only has an answer for a specific rule: a defined entry at a defined level, a defined exit, a fixed session and realistic costs. Most published support for market profile is annotated examples of days that worked, which cannot show how often the idea failed or what it cost to trade. Write the rule, test it after costs, and read the result with the trade count and drawdown first.
What is the difference between market profile and volume profile?
Market profile counts time: one 30-minute period at one price is one unit, regardless of how many contracts traded. Volume profile counts contracts: the row with the most traded volume is its point of control. On many sessions the two points of control sit close together, because the market usually trades the most where it spends the most time, but they can differ on days with a short burst of heavy volume. Both produce a point of control and a value area that must be written into exact rules before they can be tested.
How is the value area calculated?
Count the TPOs at every price row, start at the row with the most (the point of control), and then repeatedly compare the row just above the band with the row just below it, adding whichever has more TPOs. Stop when the band holds about 70 percent of the session's TPOs. The top row is the value area high and the bottom row is the value area low. Some charting programs compare two rows at a time instead of one, which can shift the edges by one row.
References
- Lo, A. W., Mamaysky, H., & Wang, J. (2000). Foundations of Technical Analysis: Computational Algorithms, Statistical Inference, and Empirical Implementation. The Journal of Finance, 55(4), 1705–1765.
- Park, C.-H., & Irwin, S. H. (2007). What Do We Know About the Profitability of Technical Analysis? Journal of Economic Surveys, 21(4), 786–826.
- Bailey, D. H., Borwein, J., López de Prado, M., & Zhu, Q. J. (2014). Pseudo-Mathematics and Financial Charlatanism: The Effects of Backtest Overfitting on Out-of-Sample Performance. Notices of the American Mathematical Society, 61(5), 458–471.