

Market breadth indicators: what they measure and how to test them
Market breadth counts how many stocks take part in an index move, so it measures participation rather than price. For an index futures strategy it is a second data series, and the only test that says anything about it is the same futures rule run with and without the breadth condition on the same bars and costs.
By Soren Huang · Published · updated · Editorial policy
Contents
- What is market breadth?
- Which market breadth indicators matter: advance-decline, new highs-lows, percent above average?
- How do you read market breadth for trend health?
- What is breadth divergence and why is it hard to test?
- What data do you need for market breadth in a backtest?
- Why can't a price-only test prove breadth works?
- How do you turn a breadth idea into a testable index futures rule?
- Frequently asked questions
- References
What is market breadth?
Market breadth is the count of how many stocks in an index take part in a move, so it measures participation rather than price. A breadth signal can enter an index futures strategy only as a second data series loaded next to the futures bars, and it is tested by running the same futures rule with and without it.
An index such as the S&P 500 is weighted by company size, so a handful of very large stocks can lift it while most members fall. Think of a stadium: the index is how loud the crowd sounds, breadth is how many people are actually cheering. A loud sound from a few voices and a loud sound from the whole crowd read the same on a price chart and very differently on a breadth chart. Breadth belongs to the group of technical analysis tools and indicators that are computed from something other than the traded instrument's own price, which is the first thing that makes it harder to test.
For a trader of ES or NQ, this matters in one practical way. Nothing in the futures bars contains a breadth count. Every breadth number has to be built from the cash stocks of the index and brought into the backtest as its own stream, which the data section below covers.
Which market breadth indicators matter: advance-decline, new highs-lows, percent above average?
The three common breadth indicators each answer a different question about participation, so pick one per question rather than stacking all three. They are built from the same daily closes of the index members, but they count different things, and two of them will often agree simply because they share the same inputs.
The advance-decline line is a running total of the number of stocks that closed up each day minus the number that closed down. New highs minus new lows is the daily count of stocks at a new 52-week high minus the count at a new 52-week low, usually read as a daily net number rather than a running total. Percent above average is the share of index members whose close is above their own moving average, commonly the 50-day or 200-day average.
| Question | Advance-decline line | New highs minus new lows | Percent above 50-day average |
|---|---|---|---|
| What is counted each day | Stocks up minus stocks down | Stocks at a 52-week high minus stocks at a 52-week low | Stocks closing above their own 50-day average |
| How the line is built | Cumulative sum, day after day | Daily net number | Percentage of members, 0 to 100 |
| Question it answers | How many rose today? | How many are at extremes? | How many are above their own trend? |
| Strong reading | Line makes a new high with the index | Net count positive and widening | High share, rising with the index |
| Weak reading | Line falls while the index holds or rises | New lows grow while the index is near its high | Share falls while the index rises |
Hypothetical example
An index of 500 stocks. On Monday 350 close up and 150 close down, so the day's net is +200 and the advance-decline line reads 200. On Tuesday 220 close up and 280 close down, the net is −60, and the line reads 140. The index itself may have risen on both days if its largest members rose; the line fell on Tuesday because most members did not.
One more choice sits under all three: the universe. A count over every issue listed on an exchange and a count over the members of one index can disagree, because the exchange list contains funds and preferred shares that are not in the index. Decide which universe you mean before you collect data, and keep it the same for the whole test.
How do you read market breadth for trend health?
A trend is healthy when the index and the breadth series make new highs together and fragile when the index climbs while fewer stocks join, so the reading is always a comparison of two series, never the breadth number alone. A breadth value by itself has no scale a trader can act on. An advance-decline line at 140, or at a hundred times that, means nothing until you ask whether it is higher or lower than it was at the index's previous high.
The practical reading is a check of dates. Find the index's most recent new high. Find the breadth series' most recent new high. If they fall on the same date or within a few bars, the move has broad participation. If the breadth high came weeks earlier and the line now sits lower, the index is being carried by fewer stocks. Because the series is daily, this is a swing-trading reading; the indicators in swing trading indicators that can be tested work on the same time scale, while the best indicators for day trading are computed from the futures bars themselves and update inside the session, which a daily breadth count cannot.
What is breadth divergence and why is it hard to test?
Breadth divergence becomes a testable rule only once the lookback, the size of the gap and the moment the signal fires are written as exact numbers, because the same chart shows a divergence under one lookback and none under another. Breadth divergence is the condition where the index makes a higher high and the breadth series makes a lower high over the same window. The idea is simple; the ambiguity is in the words "higher", "lower" and "same window".
Take one chart and one ending date. Over the last 20 bars the breadth line may have made a high above its earlier high, so there is no divergence. Over 50 bars the comparison high is a different one, and the line now sits below it, so there is a divergence. Over 100 bars the earlier high is lower again, and the divergence disappears. Nothing about the market changed; only the window did. Lo, Mamaysky and Wang (2000) made the same point about chart patterns in general: a pattern can be tested only after it is turned into an exact algorithm that a computer applies the same way every time.
Three numbers turn the picture into a rule:
- The lookback, in bars, over which "the earlier high" is found. Write one value and test its neighbours later.
- The size of the gap. A breadth high one count below the earlier high is noise. Decide the minimum shortfall, for example a percentage of the earlier high, before the first run.
- The moment the signal fires. On the bar the index makes its new high? On the first close below a short average after it? The choice moves every entry by days and changes the result.
Once the three numbers are fixed, count how many signals the rule produced over the history. A divergence rule on daily data often fires a few times a year. With so few events, a single good or bad year dominates, so the trade count must be checked before any other number is read.
What data do you need for market breadth in a backtest?
A breadth series is a second data stream that needs the index constituent list as it was on each date, a count computed from cash-market closes, and alignment to the futures session date before it can be joined to ES or NQ bars. Each of the three parts has a common mistake, and each mistake makes the backtest look better than the live rule would.
- Constituent list as of each date. Use the members the index had on that day, not today's list. Today's list contains only companies that survived and grew, so a count built from it shows stronger participation in the past than anyone could have measured at the time.
- Daily close of every constituent. For an index of about 500 stocks this is 500 price series, adjusted for splits, each of them with its own gaps and bad ticks to clean.
- Compute the counts. Advancers, decliners, new 52-week highs and lows, and the share above a chosen average, each from the same closes.
- Stamp the count to the cash-market close date and shift it to the next futures bar. The count exists only after the cash market closes, so a rule may act on it from the following futures bar onward. Letting a daily futures bar use the count of its own date is a leak of information that did not yet exist when that bar opened.
- Join to the ES or NQ daily bars on the aligned date, and check that holidays where one market was open and the other closed did not shift the two series against each other.
The work is the same kind that order flow indicators need before a backtest: a second stream that the price bars do not contain, prepared with the same care as the bars themselves. The futures side also needs its own settings right first; five settings to fix before backtesting ES and NQ covers the session, the roll and the costs that the breadth join depends on.
Why can't a price-only test prove breadth works?
A backtest run on index futures prices alone can show whether a trend rule holds after costs, but it cannot show that breadth added anything, so the ES run below is the baseline a breadth filter would have to beat, not evidence for breadth. The run never saw a breadth series. Whatever it shows belongs to the price rule.
| Price-only test | Price plus breadth test | |
|---|---|---|
| Data loaded | ES bars only | ES bars plus the breadth series |
| What the rule can see | Price pattern only | Price pattern and participation |
| What a positive result proves | The trend rule held after costs on this history | The breadth filter changed the result on this history |
| What it cannot prove | Anything about breadth | That breadth works on other indices without testing them |
The run below, made with AlphaPrime (Valynox), tested ES daily bars from 2019-01-02 to 2025-06-30, long and short, one contract, with $20 commission and $25 slippage charged on every trade. The rule is a stand-in: an Aroon rule as the only entry and exit, with no stop, no target and no filter, because breadth itself cannot be tested without the second data stream described above. The candidate shown is the one the search kept out of the 1,024 it tried (run 2026-10-31), kept for its return against its drawdown. Picking the kept one after the fact flatters it, as Bailey, Borwein, López de Prado and Zhu (2014) show for any best-of-many result, so the numbers describe this one history and nothing a reader should expect.
Source: AlphaPrime product engine (CPU), run 2026-10-31. ES daily bars, 2019-01-02 to 2025-06-30, long and short, 1 contract, $20 commission and $25 slippage per trade.
| Number | Result |
|---|---|
| Net profit (closed trades) | $142,107.5 |
| Max drawdown | $58,717.5 |
| Trades | 34 |
| Win rate | 64.71% |
| Profit factor | 2.987 |
| Average trade | $4,179.63 |
| Time in market | 91.22% |
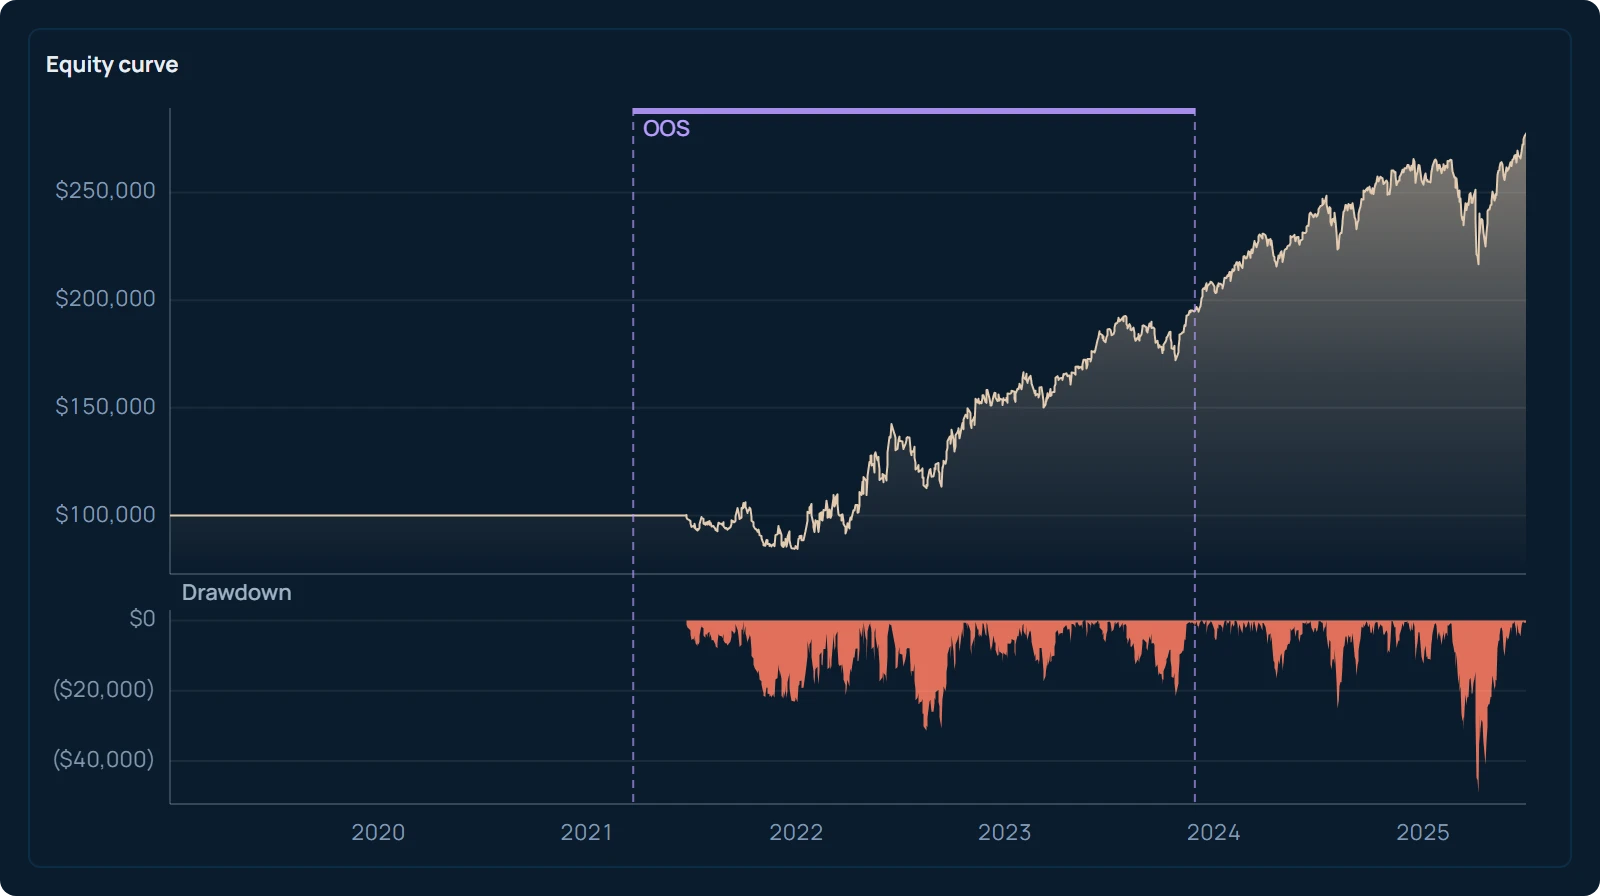
Two of the numbers tell you what a breadth filter would have to do. Thirty-four trades over six and a half years is a small sample, so any filter that removes trades will make the sample smaller still, and the comparison will rest on very few events. A time in market of 91.22% means the stand-in rule was almost always holding a position; a breadth filter that keeps the rule flat during weak participation would mostly change the result by taking it out of the market, and the question becomes whether the trades it removed were, on average, the worse ones.
How do you turn a breadth idea into a testable index futures rule?
Write the breadth rule as an exact filter or entry condition, run the same futures rule with and without it on the same bars and costs, and judge the difference with thresholds set before the run. Everything else about the two runs stays the same: the history, the session, the commission and slippage, the next-bar execution. If anything other than the breadth condition differs, the difference in results cannot be assigned to breadth.
- Write the breadth condition as an exact number. For example: the advance-decline line is below its own 50-day average, computed from the previous cash close.
- Fix the price rule and the costs. The futures entry and exit, the contract, the commission and slippage per trade, all written down.
- Run the price rule alone. This is the baseline, like the ES run above.
- Run the price rule with the breadth condition on the same bars, the condition acting as a filter that blocks entries, or as an exit, but not both at once in the first test.
- Compare average trade after costs, maximum drawdown and trade count. A higher average trade on a third of the trades is not the same as a higher average trade on most of them.
- Accept or reject against thresholds written before step 3. For example: the filtered run must improve the average trade after costs and must keep at least two thirds of the trades.
Hypothetical example
The price rule alone makes 120 trades with an average of $600 after costs and a maximum drawdown of $30,000. With the breadth filter it makes 70 trades, an average of $820 after costs and a drawdown of $22,000. The pre-written thresholds required a higher average trade and at least 80 trades kept. The average trade improved, but only 70 of 120 trades remain, so the filter fails the trade-count threshold and goes back for a looser setting, tested on data it has not yet seen.
Expect to try more than one lookback and more than one threshold for the breadth condition, and count every try. Sullivan, Timmermann and White (1999) showed that the best of many technical rules tested on the same history looks good partly because it was the best of many, and a breadth filter searched over many settings is no different. Writing the pass line before the first run is what keeps the comparison honest, and the thresholds in AlphaPrime's strategy validation are where that pass line lives once the filtered and unfiltered candidates are evaluated with the same fees, slippage and next-bar execution.
A concrete first test: pick one breadth indicator from the table in section two, write its condition with one lookback and one threshold, build the series following the five data steps, and run the two backtests on ES daily bars over the same period as the run above. Before you read either result, write down the minimum trade count and the minimum improvement in average trade after costs that you will accept.
Frequently asked questions
What is market breadth in simple terms?
Market breadth is a count of how many stocks in an index are rising, falling, or sitting at extremes, rather than how far the index itself moved. It answers the question "how many stocks took part?" An index can rise because a few very large companies rose, and breadth shows whether the rest of the index came along.
How do you read market breadth indicators?
Always compare the breadth series with the index over the same dates. Find the index's latest new high and check whether the breadth series made a new high at the same time. If it did, participation is broad; if the breadth high came earlier and the line now sits lower, fewer stocks are carrying the move. The breadth number on its own has no usable scale.
Does market breadth predict index futures?
No backtest run on futures prices alone can answer that, because the futures bars contain no breadth count. The only test that says anything is the same futures rule run with and without a breadth condition on the same bars and costs, judged against thresholds written before the run. The result applies to the index, period and settings tested, not to breadth in general.
What data do you need for market breadth?
You need the list of index members as it was on each historical date, the daily close of every member adjusted for splits, and a count computed from those closes for each day. The count is then stamped to the cash-market close date and shifted so that a futures rule can use it only from the next bar onward. Using today's member list for past dates overstates past participation, because only the survivors are on it.
References
- Lo, A. W., Mamaysky, H., & Wang, J. (2000). Foundations of Technical Analysis: Computational Algorithms, Statistical Inference, and Empirical Implementation. The Journal of Finance, 55(5), 1705–1765.
- Bailey, D. H., Borwein, J., López de Prado, M., & Zhu, Q. J. (2014). Pseudo-Mathematics and Financial Charlatanism: The Effects of Backtest Overfitting on Out-of-Sample Performance. Notices of the American Mathematical Society, 61(5), 458–471.
- Sullivan, R., Timmermann, A., & White, H. (1999). Data-Snooping, Technical Trading Rule Performance, and the Bootstrap. The Journal of Finance, 54(5), 1647–1691.