

Hilbert oscillator: what it measures, its lag, and a cycle-rule test
A Hilbert oscillator reads where price sits inside its current cycle (the phase) and how long that cycle is (the period). It is useful only while price actually cycles; in a trend its period estimate jumps between its limits and its signals become noise, so a rule built on it has to be tested out-of-sample before it is trusted.
By Soren Huang · Published · updated · Editorial policy
Contents
- What does a Hilbert oscillator measure?
- How does the Hilbert transform work, and what is its formula?
- What do phase and cycle period tell you?
- What are the typical Hilbert oscillator signals?
- How does it differ from Ehlers cycle indicators, and how do you set the parameters?
- Why does a Hilbert oscillator lag and become unstable?
- What did a stand-in cycle oscillator rule show on NQ daily bars?
- How should you test a Hilbert oscillator rule yourself?
- Frequently asked questions
- References
What does a Hilbert oscillator measure?
A Hilbert oscillator measures where price sits inside its current cycle and how long that cycle is. It treats the detrended price as a wave, builds a copy shifted by a quarter cycle, and reads an angle, the phase, from the two. It is practical only while price actually cycles; in a trend its readings turn into noise.
A Hilbert oscillator is an indicator that applies the Hilbert transform to detrended price and outputs the phase of the current cycle and the length of that cycle in bars. Detrended price is the price series with its slow drift removed, so that what remains swings above and below zero. The idea is to stop looking at price as a line going up or down and to look at it as a wave that rises, peaks, falls and bottoms, over and over.
That makes it different from most tools in a guide to technical analysis tools and indicators. A stochastic oscillator and its %K and %D settings read where price sits inside the recent high-to-low range. A Hilbert oscillator reads where price sits inside the estimated cycle: just after a bottom, near a top, or on the way down. Range and cycle are not the same thing, and the cycle is the harder of the two to estimate.
How does the Hilbert transform work, and what is its formula?
The Hilbert transform builds a copy of the price series shifted by a quarter cycle, and the original plus this shifted copy form a rotating pointer whose angle is the phase. The Hilbert transform is a calculation that, for a wave, produces the same wave delayed by one quarter of its cycle. The original series is called the in-phase part; the shifted copy is called the quadrature part. Think of a clock hand: its horizontal distance from the centre and its vertical distance from the centre together tell you the angle of the hand. Here the in-phase value is the horizontal distance, the quadrature value is the vertical distance, and the angle is the phase.
The one formula to know is:
phase = arctan(Q ÷ I)
Here I is the in-phase value on the current bar (the detrended price), Q is the quadrature value on the same bar (the quarter-cycle shifted copy), and arctan is the function that turns the ratio of vertical to horizontal distance back into an angle. The sign of I and Q tells which quarter of the circle the pointer is in, so the angle can run through all 360 degrees.
Hypothetical example
On one bar the detrended price is +3 and the shifted copy is +3, so Q ÷ I = 1 and the phase is 45 degrees: the cycle is one eighth of the way from bottom to top. On a later bar I is −4 and Q is 0, so the phase is 180 degrees, the top of the cycle. Later still, I is +2 and Q is −3.5, which puts the pointer in the lower right of the circle at about 300 degrees: the cycle is five sixths done and the next bottom is close.
In practice the quarter-cycle copy cannot be computed exactly, because the exact cycle length is not known. The indicator approximates it from a short window of past bars, and that approximation is the root of both the lag and the instability described later.
What do phase and cycle period tell you?
Phase runs from 0 to 360 degrees once per cycle, and the number of bars it takes to complete one turn is the cycle period, so a fast turn means a short cycle and a slow turn a long one. Phase is the position inside the current cycle, measured in degrees from the last bottom. The cycle period is the number of bars between one bottom and the next, which is the same as the number of bars the phase needs to climb from 0 to 360.
Read together, the two numbers answer two questions. Phase answers "how far along is this swing?": 90 degrees means the up-leg is half done, 270 degrees means the down-leg is half done. Period answers "how long should the whole swing take?": a period of 12 bars means a bottom is expected about 12 bars after the last one, a period of 30 bars means the swing is slow. The period is also what the indicator uses to choose its own quarter-cycle shift on the next bar, so an error in the period feeds straight back into the phase.
One useful property: phase keeps turning. Unlike a KD or RSI reading, which can sit above 80 for many bars in a strong move, phase does not stop at an extreme; what it does instead in a trend is turn irregularly, which is the problem covered later. The question of what a KD or RSI stuck in the overbought zone actually means has the same root cause: the indicator assumes price swings back, and the market does not always agree.
What are the typical Hilbert oscillator signals?
The usual signals are zero crossings of the oscillator, the moment the phase wraps from 360 back to 0, and the crossover of a sine line with its lead line, and each one fires at a different point of the same cycle, which is why they cannot all be right at once. The sine line is the sine of the phase, a smooth wave between −1 and +1; the lead line is the same wave shifted ahead by 45 degrees, one eighth of a cycle.
- Phase wrap. When the phase passes 360 and restarts at 0, the indicator says a bottom has just formed. This fires at the trough itself, so it is the earliest of the three relative to the turn.
- Sine / lead-sine crossover. The lead line runs ahead of the sine line, so the two cross a little before the oscillator reaches zero. This is the signal most charting packages plot, and it is similar in form to the %K and %D crossover of the KD indicator's formula and meaning, except that the second line is the same line moved forward in the cycle, not a smoothed copy.
- Zero crossing. The oscillator crosses zero upward about a quarter cycle after the bottom and downward about a quarter cycle after the top. It is the latest of the three and the least sensitive to small errors in the period.
Because the three fire in sequence, a rule that waits for all three to agree enters late in every swing, and a rule that acts on the earliest one accepts the most false turns. Which trade-off suits a market is not a matter of taste; it is a matter for the test in the last two sections.
How does it differ from Ehlers cycle indicators, and how do you set the parameters?
Ehlers cycle indicators are a family that uses the same transform with different smoothing, period limits and outputs, so the settings that matter are the smoothing length and the minimum and maximum period the indicator is allowed to find. Ehlers cycle indicators is the common name for a group of indicators that all start from detrended price, all apply the Hilbert transform, and then present a different output: a Hilbert oscillator plots the phase or its sine, a dominant cycle line plots the estimated period in bars, and a sine wave indicator plots the sine line with its lead line. The engine is shared; the dial on the front is different.
Because the engine is shared, three settings control all of them, and they change the output in predictable directions:
| Setting | Lower or shorter value | Higher or longer value |
|---|---|---|
| Smoothing length (bars used to clean the detrended price before the transform) | Earlier signals, more false turns, phase jitters bar to bar | Later signals, fewer false turns, phase turns more evenly |
| Minimum period (shortest cycle the indicator may report) | Allows very short cycles; more signals, more of them noise | Ignores short wobbles; fewer signals in choppy bars |
| Maximum period (longest cycle the indicator may report) | Caps the period low; in a trend the estimate hits the cap and stays there | Allows long cycles; the estimate can drift upward and signals space out |
| Gap between minimum and maximum | Narrow gap: steadier period, but the true cycle may lie outside it | Wide gap: can follow a changing cycle, but jumps between the limits more often |
A practical way to choose is to look at the market's own swings first. Count the bars from bottom to bottom over a quiet stretch of the history you will test on, write down the shortest and longest counts you see, and set the period limits just outside that range. Then fix those numbers before any run, so that the test measures the rule and not your ability to adjust the limits after seeing the result.
Why does a Hilbert oscillator lag and become unstable?
The transform needs a window of past bars to estimate the phase, so it lags by part of a cycle, and when price trends instead of cycling the period estimate jumps between its limits and the signals turn into noise. Lag is the number of bars between the moment a turn happens in price and the moment the indicator reports it. The quarter-cycle copy on the current bar is built from bars that are already closed, so the indicator always describes a cycle that is slightly older than the bar you are looking at. Longer smoothing adds to this; shorter smoothing reduces it but lets more noise through.
Instability is the bigger problem. The transform assumes a wave exists. When price rises for 40 bars without a bottom, there is no wave to measure, but the indicator must still report a period between its minimum and maximum. It does what any estimator does without a signal: it chases noise. The period reading jumps from near the minimum to near the maximum and back, the phase speeds up and slows down with it, and the sine line crosses its lead line at bars that mean nothing. A trader reading the chart sees a flurry of signals exactly when the market is easiest to trade with a simple trend rule.
This is the arguable claim at the centre of this article: the indicator is only as good as the cycle it is handed, and no setting of the three parameters can tell you in advance whether the next hundred bars will cycle or trend. That is a question for a test, not for the indicator.
What did a stand-in cycle oscillator rule show on NQ daily bars?
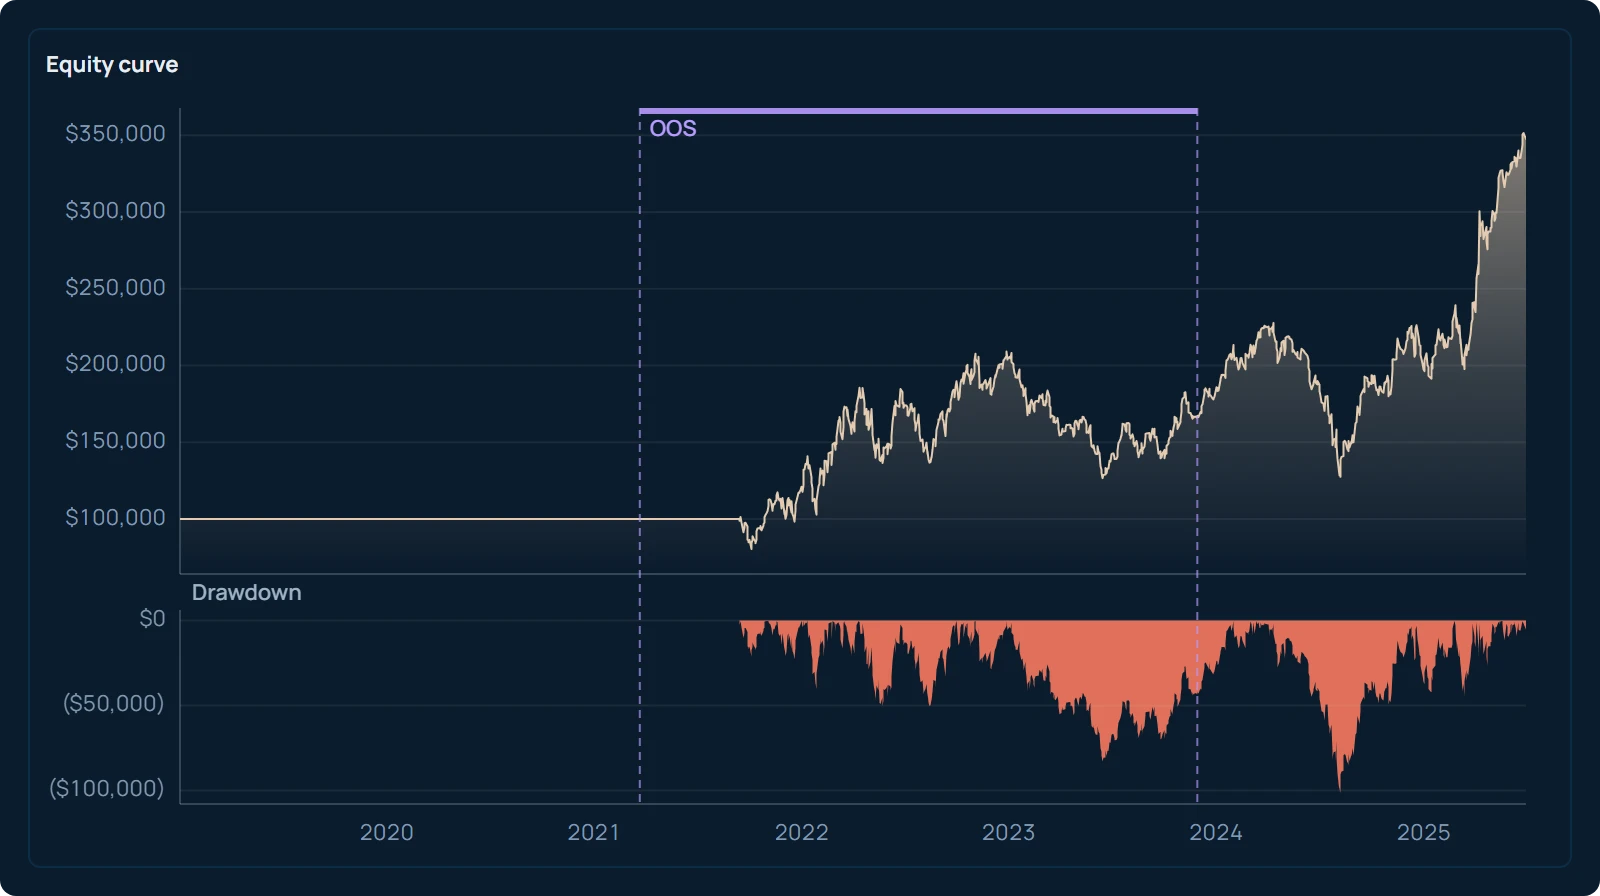
A Trend Cycle Oscillator rule, used as a stand-in for the Hilbert oscillator itself, was the one candidate kept out of about a thousand tried on NQ daily bars from 2019 to mid-2025 for its return against its drawdown, and picking the kept one after the fact flatters the result, so the numbers describe that one run and not what a reader can expect. The run did not test a Hilbert transform; it tested a cycle-style oscillator built from standard indicators, because that is what the search had available, and the result is read as an example of how a cycle rule is judged, not as a verdict on the Hilbert oscillator.
What the run tested: NQ daily bars from 2019-01-02 to 2025-06-30, long and short, one contract, with the Trend Cycle Oscillator rule as the only entry and exit, no stop or target and no filters, and $20 commission and $10 slippage charged on every trade. The search in AlphaPrime (Valynox) tried the candidates in the box and kept this one for its return against its drawdown.
Source: AlphaPrime product engine (CPU), run 2026-10-31. NQ daily bars, 2019-01-02 to 2025-06-30, long and short, 1 contract, $20 commission and $10 slippage per trade.
| Number | Result |
|---|---|
| Net profit (closed trades) | $251,455 |
| Max drawdown | $114,205 |
| Trades | 60 |
| Win rate | 63.33% |
| Profit factor | 1.864 |
| Average trade | $4,190.92 |
| Time in market | 85.7% |
Three things in the box matter more than the net profit of $251,455. First, 60 trades over six and a half years is a small sample, and an average trade of $4,190.92 built from 60 trades can move a long way if a handful of trades change. Second, time in market of 85.7 percent means the rule was almost always holding a position, so it behaved more like a slow trend-following rule than like a cycle timer, over a stretch in which NQ ended far above where it began. Third, the max drawdown of $114,205 is close to half the net profit, which is a wide swing for a rule with no stop. Bailey, Borwein, López de Prado and Zhu (2014) show why the best of many candidates looks better than it is, and Sullivan, Timmermann and White (1999) found the same effect across a large universe of technical trading rules; the reasons are laid out in why the best backtest in a search is usually inflated.
How should you test a Hilbert oscillator rule yourself?
Fix the period limits and smoothing before the run, add commission and slippage from the first test, judge the rule on out-of-sample bars it never saw, and check whether neighbouring settings behave alike before trusting any one result. A cycle rule has more ways to flatter itself than most rules, because the period limits can be nudged until the indicator "finds" the swings that happened to pay. The order of steps below removes that option.
- Write the settings and the pass rule down. Smoothing length, minimum period, maximum period, which of the three signals you trade, and the number you require out-of-sample (for example, a positive average trade after costs over at least 100 trades). Nothing on this list changes after step 3.
- Add commission and slippage. Cycle signals are frequent on short periods, and commission and slippage against the average trade is what removes the ones that only caught noise.
- Run on the in-sample bars. This run is allowed to choose between a few candidate settings; it is the study period.
- Run unchanged on the out-of-sample bars. This run is the exam, and the reasons it must stay unchanged are covered in how to split in-sample and out-of-sample data. Harvey and Liu (2015) show why a result should also be discounted for the number of candidates tried before it.
- Check neighbouring settings. Move the period limits by a few bars and the smoothing by one or two bars. If the result only holds at one exact setting, the rule described that history, not a cycle. AlphaPrime applies the thresholds you set in strategy validation to every candidate in the same order and stops the later checks when a candidate fails an earlier one, which keeps a cycle rule from being rescued by a second look at the same bars.
If step 5 fails, the fix is a new candidate with a new write-down in step 1, not a return to step 3 with the same candidate and softer limits.
A first thing to do today: open a daily chart of the market you trade, count the bars from bottom to bottom over the last two years, and write down the shortest and longest counts. Those two numbers are your period limits for step 1, chosen before the indicator has had a chance to choose them for you.
Frequently asked questions
What is a Hilbert oscillator in simple terms?
A Hilbert oscillator is an indicator that treats price as a wave and reports two things: how far along the current swing is (the phase, from 0 to 360 degrees) and how many bars the swing takes (the cycle period). It builds a copy of the detrended price shifted by a quarter cycle and reads the phase as the angle between the original and the copy. It works while price cycles and gives unreliable readings while price trends.
What is the Hilbert oscillator formula?
The phase is arctan(Q ÷ I), where I is the detrended price on the current bar and Q is the same series shifted a quarter cycle later. The arctan function turns the ratio back into an angle, and the signs of I and Q place that angle in the right quarter of the circle. The cycle period is the number of bars the phase needs to turn through a full 360 degrees.
How is a Hilbert oscillator different from Ehlers cycle indicators?
They share the same input and the same core calculation. Ehlers cycle indicators is the name of a family built on the Hilbert transform; a Hilbert oscillator shows the phase or its sine, a dominant cycle line shows the period in bars, and a sine wave indicator shows the sine line with a lead line shifted 45 degrees ahead. The smoothing length and the minimum and maximum period control all of them in the same way.
How should I set the Hilbert oscillator parameters?
Count the bars from bottom to bottom in the market you will test, set the minimum and maximum period just outside the shortest and longest counts, and pick a smoothing length that makes the phase turn evenly on quiet bars without hiding the turns. Write the three numbers down before the first run and keep them fixed through the out-of-sample test. Shorter smoothing gives earlier but noisier signals; a wider gap between the period limits lets the estimate jump more often.
Is a Hilbert oscillator practical for trading?
It is practical in markets and periods where price cycles with a fairly steady length, and it is not practical in trends, where the period estimate jumps between its limits and the signals become noise. Because you cannot know in advance which kind of market the next months will bring, treat it as a rule to test rather than a tool to trust: fix the settings, include costs, judge it out-of-sample and check neighbouring settings.
References
- Bailey, D. H., Borwein, J., López de Prado, M., & Zhu, Q. J. (2014). Pseudo-Mathematics and Financial Charlatanism: The Effects of Backtest Overfitting on Out-of-Sample Performance. Notices of the American Mathematical Society, 61(5), 458–471.
- Sullivan, R., Timmermann, A., & White, H. (1999). Data-Snooping, Technical Trading Rule Performance, and the Bootstrap. The Journal of Finance, 54(5), 1647–1691.
- Harvey, C. R., & Liu, Y. (2015). Backtesting. The Journal of Portfolio Management, 42(1), 13–28.