

Commitment of Traders report: how to test COT positioning as a rule
The Commitment of Traders report is a free weekly CFTC table of futures positions held by hedgers, large speculators and small traders. Use it as a slow weekly filter, stamp every value with its Friday release date, rank positions against their own history, and judge the filter only by an out-of-sample test against a price-only baseline.
By Soren Huang · Published · updated · Editorial policy
Contents
- What does the Commitment of Traders report show, and where do you read it?
- Why does the Tuesday-to-Friday release lag matter for a backtest?
- How do you turn positioning extremes into a testable rule?
- Does the COT report help for crude oil or index futures?
- How do you avoid look-ahead when mixing weekly COT data with daily bars?
- What does a plain daily rule on ES look like as a baseline before adding COT?
- Frequently asked questions
- References
What does the Commitment of Traders report show, and where do you read it?
The Commitment of Traders report is a free weekly CFTC table of futures positions held by commercial hedgers, large speculators and small traders in each market. You read it on the CFTC website every Friday. For a systematic trader it works as a slow weekly filter, tested with release-date alignment, not as a daily entry signal.
The Commitment of Traders report (COT report) is a table published by the U.S. Commodity Futures Trading Commission that shows, for each futures market, how many contracts each type of trader holds long and short. The legacy version splits traders into three groups. Commercial traders are firms that use futures to hedge a business, such as a refiner or a grain exporter. Non-commercial traders are large speculators whose positions are big enough to be reported, such as funds. Non-reportable traders are everyone below the reporting size, and their positions are calculated as what is left over. For each group the net position is long contracts minus short contracts. Because every long contract has a short on the other side, the three net positions add up to zero.
The CFTC publishes more than one version of the report. The table shows the ones that matter for a rule test.
| Report version | Trader groups | Best used for |
|---|---|---|
| Legacy | Commercial, non-commercial, non-reportable | Longest history; the usual base for a positioning index |
| Disaggregated | Producer/merchant, swap dealers, managed money, other reportables | Physical commodities such as crude oil and grains |
| Traders in Financial Futures (TFF) | Dealer/intermediary, asset manager, leveraged funds, other reportables | Index, bond and currency futures |
Where to read the COT report: the CFTC publishes the current week as web tables and the full history as downloadable files on its Commitments of Traders page. For a backtest, use the historical files, because you need every weekly value in a time series, not a screenshot of the latest week. The CFTC Explanatory Notes describe how each group is defined and how spreading positions are counted; read them once before you build anything on the numbers.
The report gives one value per market per week. That is why it belongs to the family of slow filters, not to the set of tools covered in day trading indicators and where each one fails or in the test of the best indicator for intraday trading. A day trader may take fifty decisions between two COT releases; a filter that cannot change for a week cannot drive those decisions. It can decide which direction the faster rule is allowed to trade.
Why does the Tuesday-to-Friday release lag matter for a backtest?
Positions are counted as of Tuesday's close but released on Friday afternoon, so the first bar your rule may act on is the first session after the release, and a backtest that uses the Tuesday date is reading the future. The CFTC releases the report on Friday at 3:30 p.m. Eastern time, three days after the position date. A week with a US holiday pushes the release to a later day. In a backtest this gap is the whole difference between a rule you could have traded and a rule that knew positioning three days early.
Think of a football score printed in Saturday's newspaper. The match was played on Tuesday, but nobody who only reads the paper knew the score until Saturday. A backtest that places the COT value on the Tuesday bar lets your rule bet on Wednesday with Saturday's newspaper in hand. The error is quiet because the data is real; only its timing is wrong.
The first bar a rule may act on depends on the market's session. The release lands after the Friday day session has closed for US equity index futures, so for CME index futures the first usable bar opens on Sunday evening US time, when the next Globex session starts. Exchanges change session hours from time to time, so confirm the current schedule on the exchange's contract page, or check the session times in your own time zone with the free futures market hours by exchange tool.
Hypothetical example
Suppose a rule goes long when a positioning index rises above 80. The index crosses 80 on the report dated Tuesday 3 March, which is released on Friday 6 March. A backtest stamped by position date enters on Wednesday 4 March. A backtest stamped by release date enters on the first session after Friday, which opens Sunday 8 March in US time. If the market moved 2 percent between Wednesday and Sunday, the wrong backtest books that move; the honest one never saw it.
How do you turn positioning extremes into a testable rule?
Rank the current net position of one trader group against its own history over a fixed lookback, which turns it into an index from 0 to 100, write the extreme thresholds down before the test, and define exactly what the rule does when the index crosses them. A positioning index is a number that says where this week's net position sits between the lowest and the highest net position of the same group over the lookback window. A raw net position read on its own, as a count of contracts, means little; knowing that it is the most short that group has been in three years means something you can test.
The one formula:
positioning index = (net now − lowest net in lookback) ÷ (highest net in lookback − lowest net in lookback) × 100
Here net now is this week's long minus short for the group you chose, lowest net in lookback and highest net in lookback are the smallest and largest net values of that group over your window, and the result is 0 when positioning is at its lowest point of the window and 100 at its highest.
The steps, in the order that keeps the test honest:
- Choose one market and one trader group. Commercials in a commodity, or leveraged funds in a financial future from the TFF report. Changing the group after seeing results is a second test, not a refinement.
- Fix the lookback. Three years is about 156 weekly values. Write it down.
- Compute the index from the historical file, using only the values released before each bar (the next sections cover alignment).
- Write the thresholds and the action before the run. For example: below 20, the faster rule may only go short; above 80, it may only go long; in between, both directions. Or the opposite, if your reasoning is that commercial extremes are contrarian. Pick one reading in advance.
- Test the baseline rule without the filter, then with it, on the same bars, costs and sessions, and compare out-of-sample.
Hypothetical example
Over a 156-week window, the lowest commercial net position in a market was −60,000 contracts and the highest was +20,000. This week's net is −52,000. The index is (−52,000 − (−60,000)) ÷ (20,000 − (−60,000)) × 100 = 8,000 ÷ 80,000 × 100 = 10. Under a written rule "below 20, longs only for the faster entry", the daily rule may take long signals from the first session after this value is released, until a later release moves the index back above 20.
A threshold crossing is the same kind of rule as a band crossing in a Bollinger Bands strategy and its backtest: the levels, the lookback and the direction are all settings, and every extra pair of levels you try is another test. Harvey and Liu (2015) show why the result of the best pair among many must be discounted for the number of tries behind it. Two thresholds, one lookback, one group: that is enough to test, and few enough to trust. For how this filter sits beside price-based tools, see the guide to technical analysis tools and indicators you can test.
Does the COT report help for crude oil or index futures?
Crude oil has a large hedger presence, so commercial positioning carries more information there than in index futures, where commercial positions mostly reflect dealer hedging; the only honest answer for a given market is the out-of-sample test you run yourself. In crude oil the commercial group contains producers, refiners and merchants whose positions follow physical business. In an equity index future, the firms classified as commercial in the legacy report are mainly dealers hedging products they sold to clients, which is why the CFTC publishes the separate TFF report for financial futures.
| Question | Crude oil futures | Equity index futures |
|---|---|---|
| Who are the commercials? | Producers, refiners, merchants, swap dealers | Mostly dealers and intermediaries |
| What does their position reflect? | Physical hedging of barrels bought and sold | Hedging of client products and structured positions |
| How large is the hedger share? | Usually a large part of open interest | Usually smaller; asset managers and funds dominate |
| Which group's extremes are watched? | Commercials (legacy) or producer/merchant (disaggregated) | Asset managers and leveraged funds (TFF) |
| What to test first? | Commercial index as a direction filter | Leveraged-funds index as a direction filter |
The reasoning says where to look first; it does not say what you will find. A market can have a strong hedger presence and still show no usable relationship between positioning extremes and later price moves after costs. The test is the same in both markets: baseline rule without the filter, then with it, over the same bars, judged out-of-sample with a rule written in advance.
How do you avoid look-ahead when mixing weekly COT data with daily bars?
Stamp each COT value with its release date, carry it forward unchanged until the next release, and run a one-bar shift check so the value visible on any bar is one that was already public when that bar opened. Look-ahead bias is a backtest error where a rule uses information that was not available at the time of the decision. Weekly data on daily bars is one of the most common places it hides, because the historical files are dated by position date, not by release date.
The procedure:
- Add a release-date column to the weekly file. For a normal week it is the Friday after the Tuesday position date; for holiday weeks take the actual release date from the CFTC schedule.
- Set the first usable bar to the first session that opens after the release time. For a daily bar series, that is the first daily bar after Friday.
- Carry the value forward. Every daily bar until the next usable bar sees the same index value. A filter that changes once a week should look like a staircase on a daily chart, not a line.
- Run the one-bar shift check. Move the whole COT series one bar later and rerun. A slow weekly filter should give almost the same result. If the result changes a lot, a value was being used on a bar before it was public.
The shift check is the same idea as the one-bar test for price data described in look-ahead bias in backtests and the one-bar check. For a filter that only switches direction a few times a year, a one-day delay should barely move the equity curve. When the baseline and the filtered version both pass through the walk-forward windows of strategy validation in AlphaPrime (Valynox), the filter is graded on windows whose COT values and prices were both unseen when its thresholds were written, which is the only comparison that counts.
What does a plain daily rule on ES look like as a baseline before adding COT?
Before you can say whether a COT filter helps, you need a baseline built from price alone, measured with the same bars, costs and sessions the filtered version will use. The box below is such a baseline. It is not a COT test: the run used a Momentum rule as its only entry and exit, a stand-in rule built from a standard indicator, with no stop, no target and no filter of any kind. The search tried 1,024 candidates on ES daily bars from 2019-01-02 to 2025-06-30 and kept one for its return against its drawdown. The figures describe that one kept candidate.
Source: AlphaPrime product engine (CPU), run 2026-10-31. ES daily bars, 2019-01-02 to 2025-06-30, long and short, 1 contract, $20 commission and $25 slippage per trade.
| Number | Result |
|---|---|
| Net profit (closed trades) | $91,147.5 |
| Max drawdown | $45,397.5 |
| Trades | 242 |
| Win rate | 54.13% |
| Profit factor | 1.286 |
| Average trade | $376.64 |
| Time in market | 74.52% |
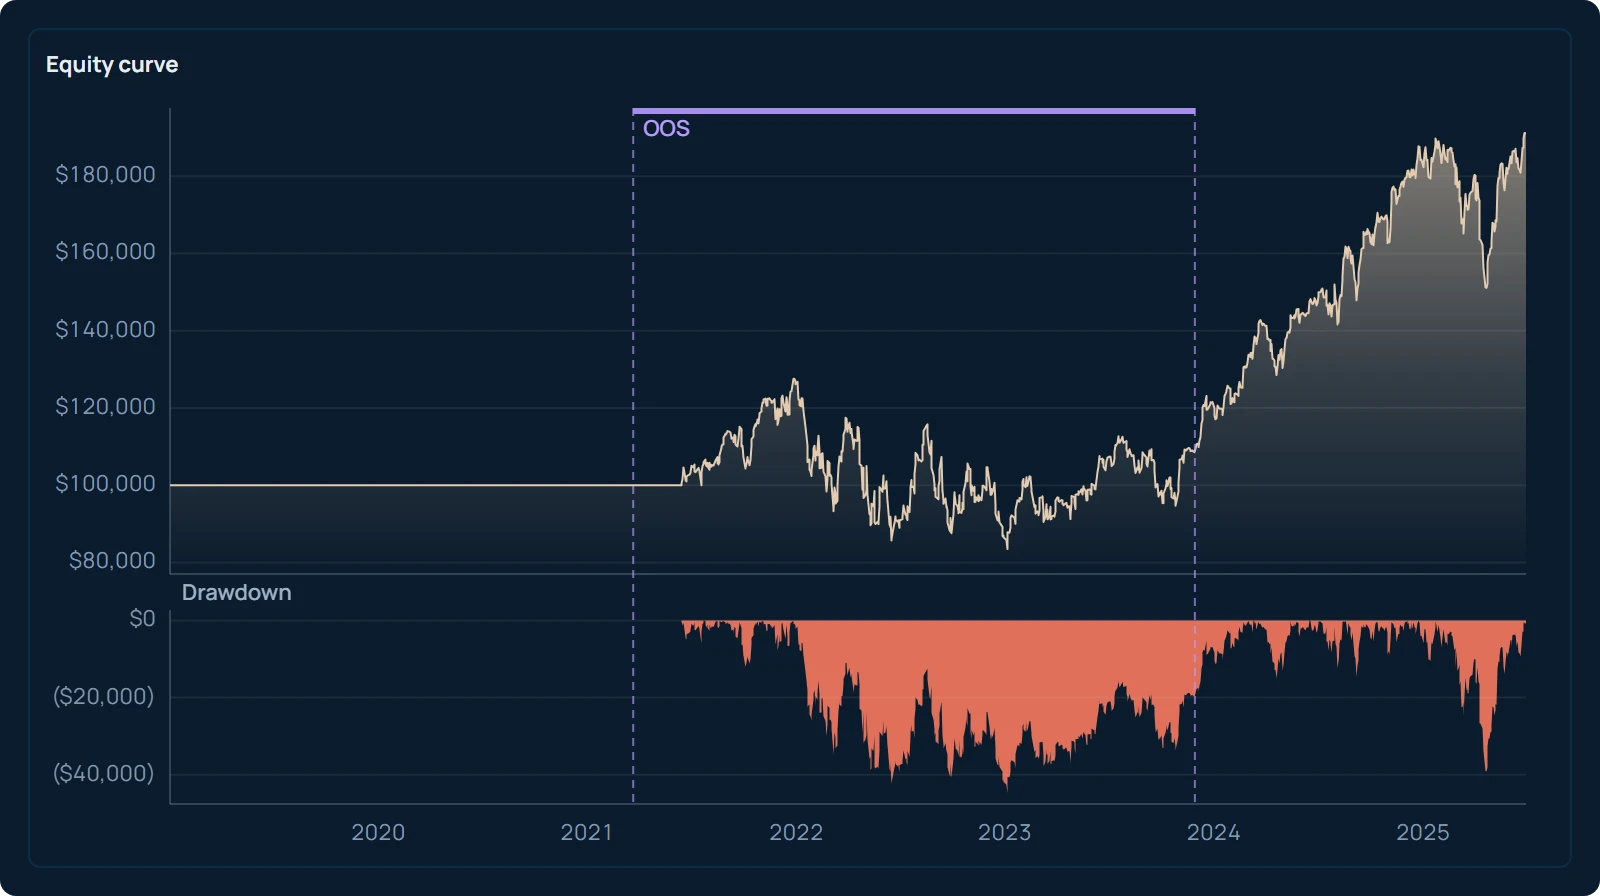
Read the box as a description of a search, not as a result anyone can expect. The kept candidate was chosen after all 1,024 were run, and picking the best of many after the fact flatters it; a large part of the gap between it and the average candidate is selection, not edge. The Momentum indicator did not earn $91,147.5, and the rule does not promise anything forward. What the box gives you is a reference point: a net profit of $91,147.5 against a max drawdown of $45,397.5 over 242 trades, with $45 of commission and slippage charged on every trade, and 74.52% of the time spent in the market.
That last figure is the one a COT filter would change first. A direction filter that only allows longs when a positioning index is above 80 and only shorts when it is below 20 will cut time in market and trade count. The question for the test is whether the trades it removes were, out-of-sample, the worse ones. Three outcomes are possible: the filtered version keeps most of the return with a smaller drawdown, it removes return and drawdown in the same proportion, or it removes mostly good trades. Only the first outcome is a reason to keep the filter, and only when it holds on data the thresholds never saw.
The next step is concrete. Take the ES daily bars you already have, download the TFF historical file from the CFTC, build a leveraged-funds positioning index with a 156-week lookback, stamp it by release date, and write the two thresholds and the direction rule on paper. Run the baseline and the filtered version over the same period with the same costs, compare them on the out-of-sample windows only, and run the one-bar shift on the filtered version before you believe any difference.
Frequently asked questions
What is the Commitment of Traders report?
The Commitment of Traders report is a weekly table published by the U.S. Commodity Futures Trading Commission. For each futures market it lists the long and short positions held by groups of traders, such as commercial hedgers, large speculators and small traders. Positions are counted as of Tuesday's close and published on Friday afternoon. The report shows positioning, not prices, and it changes once a week.
Where do I read the COT report?
On the CFTC website, on its Commitments of Traders page. The current week is shown as web tables for each report version, and the full history is available as downloadable files. For a backtest you need the historical files, because a rule test needs every weekly value in order, with a release date attached to each one.
How do I read the Commitment of Traders report?
Pick one market and one trader group, then subtract the group's short contracts from its long contracts to get its net position. Compare that net position with its own history over a fixed window, for example three years, to see whether it is near a high or a low. A positioning index from 0 to 100 does this comparison in one number. Reading the raw contract count without this comparison tells you little, because the normal size of a group's position differs from market to market.
Does the COT report work for crude oil?
Crude oil is a market where the commercial group holds a large share of open interest and its positions follow physical hedging, so commercial positioning is a reasonable thing to test there. Whether it changes a strategy's out-of-sample result after costs is a question only your own test answers. Build a price-only baseline, add the positioning filter with release-date alignment, and compare the two on data the thresholds never saw.
When is the COT report released?
The CFTC publishes the report every Friday at 3:30 p.m. Eastern time, showing positions as of the previous Tuesday's close. In weeks with a US federal holiday the release moves to a later day. A backtest must use the release date, not the Tuesday position date, as the first moment the value is known.
References
- U.S. Commodity Futures Trading Commission. Commitments of Traders. https://www.cftc.gov/MarketReports/CommitmentsofTraders/index.htm
- U.S. Commodity Futures Trading Commission. Explanatory Notes: Commitments of Traders. https://www.cftc.gov/MarketReports/CommitmentsofTraders/ExplanatoryNotes/index.htm
- Harvey, C. R., & Liu, Y. (2015). Backtesting. The Journal of Portfolio Management, 42(1), 13–28.
- CME Group. E-mini Nasdaq-100 Futures Contract Specs. https://www.cmegroup.com/markets/equities/nasdaq/e-mini-nasdaq-100.contractSpecs.html