

TAIEX Futures Night vs Day Session Statistics, 2017–2026
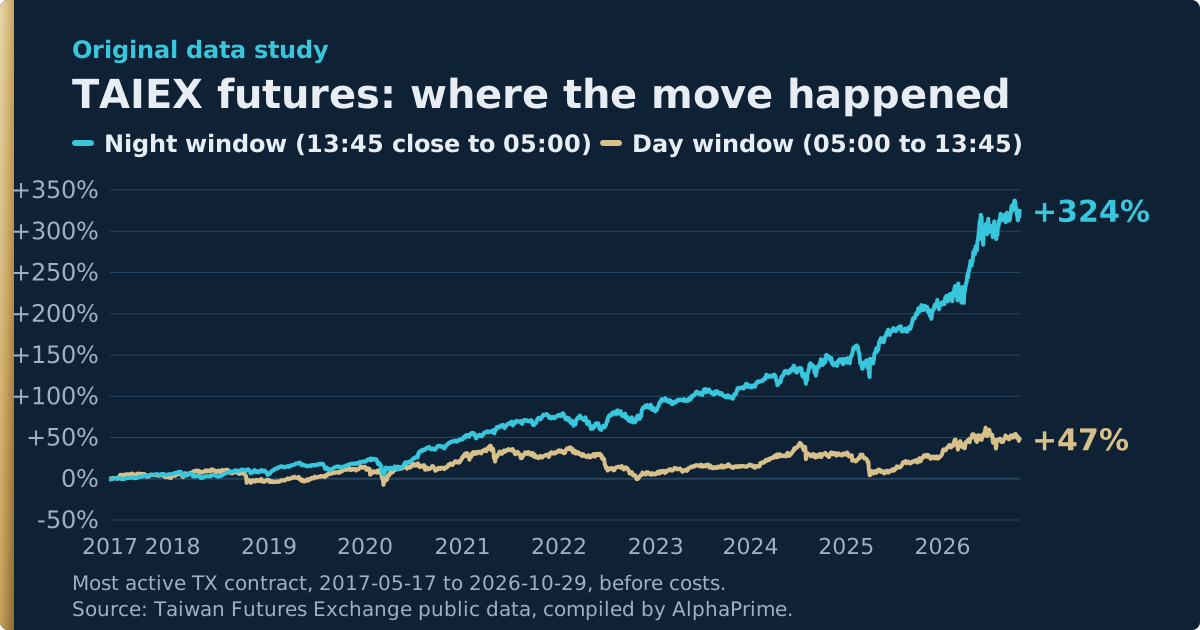
The TAIEX futures night session grew from 8.5% of volume in 2017 to 41.5% in 2026, and 79.0% of the cumulative log return fell in the night window. These figures are before costs; at an assumed 0.05% round trip, the night window alone drops to +34.1%.
By Soren Huang · Published · updated · Editorial policy
Contents
The TAIEX futures night session (台指期夜盤) grew from 8.5% of volume in 2017 to 41.5% in 2026, and 79.0% of the cumulative log return fell in the night window. After an assumed cost, trading only that window drops from +323.6% to +34.1%.
These are historical market statistics, not trading advice, and the future may differ.
How were these numbers calculated?
The data is Taiwan Futures Exchange public data, 2017–2026, compiled and calculated by AlphaPrime. The contract is TAIEX futures (TX), from 16 May 2017 to 29 October 2026: 2306 trading days.
| Item | Definition |
|---|---|
| Night session | 15:00 on the previous trading day to 05:00. TAIFEX counts it toward the next trading day; see TAIEX futures trading hours. |
| Day session | 08:45 to 13:45. |
| Night window return | Night close ÷ previous day-session close. It runs from 13:45 to 05:00 and includes the untraded 13:45 to 15:00 gap. |
| Day window return | Day close ÷ that morning's night close. It runs from 05:00 to 13:45 and includes the untraded 05:00 to 08:45 gap. |
| Contract | The monthly contract with the largest day-session volume each day, excluding weeklies and spreads. All prices for a day come from the same contract, so a roll creates no gap. |
| Volume | All single-leg contracts including weeklies, excluding spread rows, counted one-sided. |
| High-low range | (High − low) ÷ previous day-session close, as a yearly median. |
| Big move day | Day close moved 2% or more from the previous day close. |
| Costs | All statistics are before costs. The cost test assumes 0.05% per round trip (about 10 points with TX at 20,000), covering commission, futures transaction tax and slippage. It is a deliberately pessimistic assumption, not a measured value. |
The return split uses 2300 days. The 6 missing days: the first day, 2017-05-16, has no previous close to compare; 2017-06-05, 2017-10-02, 2018-04-02, 2018-07-11 and 2018-12-24 have no night row. In the tables, 2017* starts on 16 May and 2026* ends on 29 October.
How big is night session volume?
The night session is now about 40% of TAIEX futures volume, averaging about 55 thousand (k) contracts a day in 2026. Over the whole period it was 29.9%.
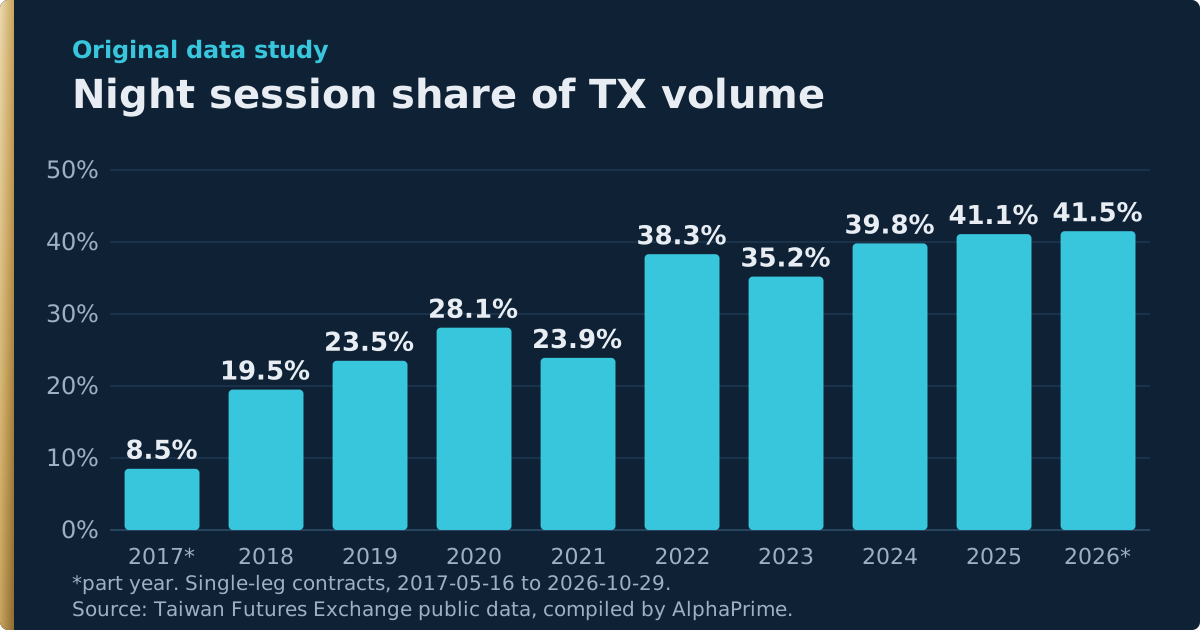
| Year | Trading days | Night share | Night avg (k) | Day avg (k) |
|---|---|---|---|---|
| 2017* | 161 | 8.5% | 12 | 133 |
| 2018 | 247 | 19.5% | 37 | 153 |
| 2019 | 242 | 23.5% | 33 | 108 |
| 2020 | 245 | 28.1% | 53 | 136 |
| 2021 | 244 | 23.9% | 42 | 134 |
| 2022 | 246 | 38.3% | 67 | 108 |
| 2023 | 239 | 35.2% | 49 | 90 |
| 2024 | 242 | 39.8% | 64 | 97 |
| 2025 | 243 | 41.1% | 51 | 73 |
| 2026* | 197 | 41.5% | 55 | 77 |
The rising share is not only a bigger night session. Since 2022 the night average has stayed between about 50 and 67 thousand contracts, while the day average fell from 134 thousand in 2021 to 77 thousand in 2026.
Is the night session less volatile than the day session?
It used to be. Since 2022 the two are about the same. The 2017 night median range was half the day range; in 2026 the night range is slightly larger.
| Year | Day range | Night range | Day open gap |
|---|---|---|---|
| 2017* | 0.63% | 0.31% | 0.06% |
| 2018 | 0.82% | 0.61% | 0.14% |
| 2019 | 0.65% | 0.50% | 0.13% |
| 2020 | 1.16% | 0.87% | 0.19% |
| 2021 | 1.13% | 0.72% | 0.16% |
| 2022 | 1.08% | 1.14% | 0.18% |
| 2023 | 0.77% | 0.74% | 0.13% |
| 2024 | 1.07% | 1.09% | 0.15% |
| 2025 | 1.01% | 1.06% | 0.18% |
| 2026* | 1.64% | 1.69% | 0.26% |
The day open gap is the absolute difference between the day open and that morning's night close. Its median over the whole period is 0.15%.
Which session did the move happen in?
Mostly the night window. Over the period it adds up to +323.6%, against +46.8% for the day window and +521.9% combined; 79.0% of the log return fell in the night window. AlphaPrime's backtesting sets the trading session per run, so a day-only test leaves out the night window where 79.0% of the log return fell.
| Year | Night | Day | Same way | ±2% days |
|---|---|---|---|---|
| 2017* | +5.8% | +2.9% | 46.2% | 0 |
| 2018 | +0.6% | −4.0% | 52.5% | 10 |
| 2019 | +13.1% | +15.3% | 47.5% | 3 |
| 2020 | +22.9% | +8.4% | 52.7% | 25 |
| 2021 | +19.2% | +8.0% | 45.5% | 19 |
| 2022 | +4.4% | −21.1% | 49.2% | 31 |
| 2023 | +15.7% | +11.6% | 43.9% | 5 |
| 2024 | +13.4% | +10.7% | 48.3% | 27 |
| 2025 | +29.0% | −0.3% | 50.2% | 27 |
| 2026* | +36.1% | +13.4% | 44.2% | 57 |
| All | +323.6% | +46.8% | 48.2% | 204 |
The night window was ahead in 9 of the 10 calendar years; 2019 was the exception. The two windows moved the same way on 48.2% of days, about a coin flip, so this gives no sign that one session's direction carries into the next. On the 204 big move days, the night window moved more than the day window 40.2% of the time.
What does this mean for traders?
My read: use this chart to check your backtest data, not as a strategy.
- A day-only backtest misses most of the move. See night sessions in backtests.
- Cut daily bars the same way every time. Vendors that cut them differently give different opens, highs and lows; see which night close price to use.
- Old night stops may be too tight. A night stop tuned on 2017 to 2021 data may get hit too easily at today's ranges.
- Trading every day costs a lot. At 2300 round trips and 0.05% each, the night window goes from +323.6% to +34.1% and the day window from +46.8% to −53.5%.
What are the limits of this study?
- The cumulative figures include futures basis convergence (the discount around dividend season, for example) and rolls. The most active contract closed at 10022 at the start and 46577 at the end, up 364.7%, which differs from the combined +521.9%. See TAIEX futures vs the index.
- It uses daily open, high, low and close only, so it can't see intraday order, and no significance test was run.
- Both windows include untraded gaps, so they are not the same as moves during trading hours.
- The cost is an assumption. Real slippage changes with session, market conditions and position size.
- 2017 and 2026 are part years. 2026 has 57 of the 204 big move days, so recent markets weigh heavily on the result.
Common questions
What are the TAIEX futures night session hours?
15:00 to 05:00 the next morning, Taiwan time. The day session is 08:45 to 13:45. TAIFEX counts night trades toward the next trading day.
How much volume does the TAIEX futures night session trade?
In 2026 to 29 October it averaged about 55 thousand contracts a trading day, 41.5% of all TAIEX futures volume. That counts single-leg contracts including weeklies, one-sided.
When did the TAIEX futures night session start?
TAIFEX started after-hours trading on 15 May 2017. This study starts from the first trading day with a night session, 16 May 2017.
Is the night session more volatile than the day session?
They are about equal now. In 2026 the median range is 1.69% at night and 1.64% in the day; in 2017 it was 0.31% and 0.63%.
Does trading only the night session make more money?
This study can't show that. Before costs the night window adds up to +323.6%; at an assumed 0.05% round trip it is +34.1%, and the figure includes basis convergence. Past statistics may not repeat.
How do I cite this study?
AlphaPrime, "TAIEX Futures Night vs Day Session Statistics, 2017–2026", 2026, https://alphaprime.trading/en/learn/taifex-night-vs-day-session-statistics/
Monthly statistics table: download the CSV.
Sources
- Taiwan Futures Exchange public data, 2017–2026, compiled and calculated by AlphaPrime.
- Night session launch date: Taiwan Futures Exchange, history page, https://www.taifex.com.tw/cht/1/originOfEstablish (read 2026-10-30)