

What Are the Quant Trading Strategies? Four Common Types and How Their Backtests Differ
Quant trading strategies come in four common types: trend following, mean reversion, breakout and momentum. The core difference is whether you bet that price will keep going or come back to where it was. That choice shapes a backtest's win-rate pattern, profit per trade, holding period and the market where it leads, and it tells you what to check first for each type.
By Soren Huang · Published · updated · Editorial policy

Contents
- What are the quant trading strategies?
- How does a trend-following strategy work, and what does its backtest look like?
- How does a mean-reversion strategy work, and what does its backtest look like?
- How do breakout and momentum strategies differ from trend-following?
- Which quant trading strategy earns the most? Why the answer changes with the market
- Which quant trading strategy suits a beginner?
- How do you validate a quant trading strategy so that you can trust the backtest?
- Frequently asked questions
- References
What are the quant trading strategies?
A quant trading strategy is one that uses rules fixed in advance to decide entries and exits. There are four common types: trend following, mean reversion, breakout and momentum. They differ on one point: whether you bet that price will continue, or that it will return to where it was. That choice determines each type's win-rate pattern in a backtest, the size of its profit per trade, how long it holds, and which market it leads in.
Think of it this way: betting on continuation is like seeing a bus pull away and chasing it. Most of the time you won't catch it, but when you do, you can ride a long way. Betting on reversion is like a stretched rubber band. Most of the time it snaps back, but occasionally it breaks. Trend following, breakout and momentum all bet on continuation, differing in entry timing and holding length. Mean reversion bets on return. The table below compares the four; the sections that follow look at what each one looks like in a backtest report.
| Type | Bet | Typical holding | Trades per year, daily bars | Win-rate shape | Leads in |
|---|---|---|---|---|---|
| Trend following | Continuation | Weeks to months | Few | Low win rate, a few large winners | Trending markets |
| Mean reversion | Return to mean | Hours to days | Many | High win rate, small winners | Range-bound markets |
| Breakout | Continuation | Hours to days | Many | Medium | Expansion after a range |
| Momentum | Continuation | Days to weeks | Medium | Medium | Trending markets |
These four are not textbook categories. They are shapes a backtest reveals on its own. Two reports can both show a positive net profit, yet one may be carried by three large winners while the other is built from hundreds of small wins. The two need entirely different checks. If you trade TAIEX futures or US index futures, Five types of futures algo trading strategies and how to backtest each maps these types onto specific instruments and timeframes.
How does a trend-following strategy work, and what does its backtest look like?
A trend-following strategy enters with the trend once price has established a direction, and exits only after the direction reverses. Its backtest typically shows a low win rate, a few large winners carrying all the profit, and long drawdowns through sideways periods. A trend-following strategy waits until price shows it has a direction, then follows it. Common rules: go long when a fast moving average crosses above a slow one and exit when it crosses back, or go long on a close above the N-day high and exit on a break below the N-day low.
Rules like these are structurally late on entry and late on exit. They wait for the trend to form before entering, and wait for it to reverse for a while before exiting. The cost is that the head and tail of every move go to the market. The benefit is that one long trend can cover many small losses. On daily bars a single trade often lasts weeks to months, so the number of trades per year is structurally small, often somewhere between single digits and a dozen. Two things to check:
- Is the profit concentrated in a few trades or a few periods? Sort trades by P&L and remove the largest three to five. Does the remaining net profit stay positive? Then look at results year by year or quarter: did one year earn everything while the others sat in drawdown?
- Is the sample large enough to judge? Ten years of daily bars may contain only a few dozen trades. That sample gives a very unstable estimate of average profit per trade. Swapping out two or three trades can change the result substantially.
Hypothetical example
A TAIEX futures moving-average crossover strategy on daily bars, eight years of backtest, 30 trades in total: 20 small losses averaging 300 points each, and 10 winners, of which 7 averaged 400 points and 3 made 3,000 points each. Total P&L is −6,000 + 2,800 + 9,000 = 5,800 points. Remove those three large winners and what remains is −3,200 points. The whole result rests on three trades, and with only 30 trades over eight years there is not enough data to tell whether those three reflect a rule or luck.
Drawdowns through sideways periods are normal for this type. Price crosses the moving average back and forth, and the strategy keeps entering and exiting, taking small losses each time. To judge a trend strategy, do not ask how much it makes in one-directional markets. Ask whether its losses in choppy periods are manageable, and whether its drawdowns last longer than you can hold on.
How does a mean-reversion strategy work, and what does its backtest look like?
A mean-reversion strategy enters against a price move once price has stretched far from its average, and exits as price returns near the average. Its backtest typically shows a high win rate, small profit per trade, many trades, and occasionally one large loss. A mean-reversion strategy bets that price, once far enough from its average, will pull back. Common rules: buy when price drops a set distance below a moving average and sell when it returns to the average, or buy when an oscillator such as RSI enters oversold territory and sell when it reaches the midpoint.
This shape is the reverse of the trend strategy. Most of the time price does pull back, so the win rate is often high. But the pullback is only the distance from the entry point back to the average, so each winner is small. The danger is the time price doesn't pull back. A one-directional move can keep a counter-trend position losing, and if the rule only exits on "return to average," that one trade can wipe out dozens of small gains. So the checks are:
- How large is the largest single loss relative to the average winner? If the largest loss equals the combined profit of 20 average winners, the strategy cannot survive a miss every 20 trades.
- Is the largest run of consecutive losses bigger than the drawdown you can tolerate? Trends usually run for several days in a row, and a counter-trend strategy takes hits in a row.
Hypothetical example
The same mean-reversion strategy on TAIEX futures daily bars, two years of backtest, 30 trades in total: 22 winners averaging 120 points each, totaling 2,640 points; 8 losers, of which 7 averaged 150 points for a total of 1,050 points, and one that hit a one-directional sell-off and lost 1,800 points. Total P&L is 2,640 − 1,050 − 1,800 = −210 points. The win rate is above 70%, yet the result is negative, because one large loss cancelled 22 small wins.
A common fix is a fixed stop or a time stop. But a stop also turns some trades that would have pulled back into losses. So compare two backtest reports, one with the stop and one without, rather than adding a stop by feel. The formula, common parameters and a backtestable futures example for mean reversion are in Mean-reversion strategy formulas and a futures backtest example.
How do breakout and momentum strategies differ from trend-following?
Breakout and momentum strategies both enter earlier, hold for shorter periods and trade more often than moving-average trend strategies. That makes them the most sensitive to commissions and slippage. A small error in cost assumptions can flip the conclusion. A breakout strategy uses the boundary of a price range as its entry point: go long when price crosses above the highest high of the last N days, short when it breaks below the lowest low, betting on expansion after the range ends. A momentum strategy uses the strength of recent returns as its entry condition: go long if returns over a past window are positive, short if negative. Moskowitz, Ooi and Pedersen (2012) call the rule that uses an asset's own past returns as its signal time-series momentum.
Within the same move, the three enter at different points. A breakout strategy enters at the top of the range. A momentum strategy enters after the first few strong bars. A moving-average trend strategy waits for the crossover and usually enters last. Earlier entries also exit earlier. Holding periods run from hours to days or weeks, so there are more trades and smaller profit per trade, and costs take up a bigger share of each one.
| Comparison | Breakout | Momentum | Trend following (moving-average) |
|---|---|---|---|
| Entry point | Range boundary | After the first few strong bars | After the moving-average cross |
| Typical holding | Short: hours to days | Medium: days to weeks | Long: weeks to months |
| Trades per year | Many | Medium | Few |
| Sensitivity to costs | High | Medium | Low |
| Common failure | False breakout back into the range | Sharp reversal after strength | Whipsawed in sideways markets |
Hypothetical example
A breakout strategy makes 60 trades a year and earns an average of $150 per trade before costs. A trend strategy makes 8 trades a year and earns an average of $900 per trade before costs. With a round-trip cost of $45, the breakout strategy nets 60 × ($150 − $45) = $6,300, and the trend strategy nets 8 × ($900 − $45) = $6,840. Raise costs to $90 and the breakout strategy falls to $3,600, while the trend strategy falls to $6,480. Doubling costs cuts the breakout strategy's net profit by more than 40%, but only about 5% for the trend strategy.
This is why breakout and momentum backtests should include commissions and slippage from the first run, and why you should rerun them with doubled costs to see whether they stay positive. For how to estimate round-trip costs for your own instrument, and how many times the average trade should cover those costs, see Trading costs in backtests: commissions, slippage and average trade.
Which quant trading strategy earns the most? Why the answer changes with the market
First, the nature of the backtest box in this section. Its result is the one candidate, out of 1,024 tried, that the search kept based on return against drawdown. That makes its numbers look better than anything you could actually trade. It also uses a Stochastics rule as a stand-in standard indicator rule. It is not a prototype of any of the four types, so it does not answer "which earns the most." It is here to show how to read a real report together: trade count, drawdown and time in market, not just net profit.
This run by AlphaPrime (Valynox) tested ES (E-mini S&P 500) daily bars from 2019-01-02 to 2025-06-30, long and short, 1 contract. Entries and exits used only one Stochastics rule, with no stop, no target and no filter, and each trade carried a $20 commission and $25 slippage. The search tried 1,024 candidates and kept this one for its return against its drawdown. Choosing the best of more than a thousand variants inflates its numbers on its own. Bailey, Borwein, López de Prado and Zhu (2014) show that the more variants you try, the further the best backtest tends to drift from real performance.
Source: AlphaPrime product engine (CPU), run on 2026-10-31. ES daily bars, 2019-01-02 to 2025-06-30, long and short, 1 contract, $20 commission and $25 slippage per trade.
| Number | Result |
|---|---|
| Net profit (closed trades) | $94,192.5 |
| Max drawdown | $60,292.5 |
| Trades | 41 |
| Win rate | 60.98% |
| Profit factor | 1.713 |
| Average trade | $2,297.38 |
| Time in market | 93.75% |
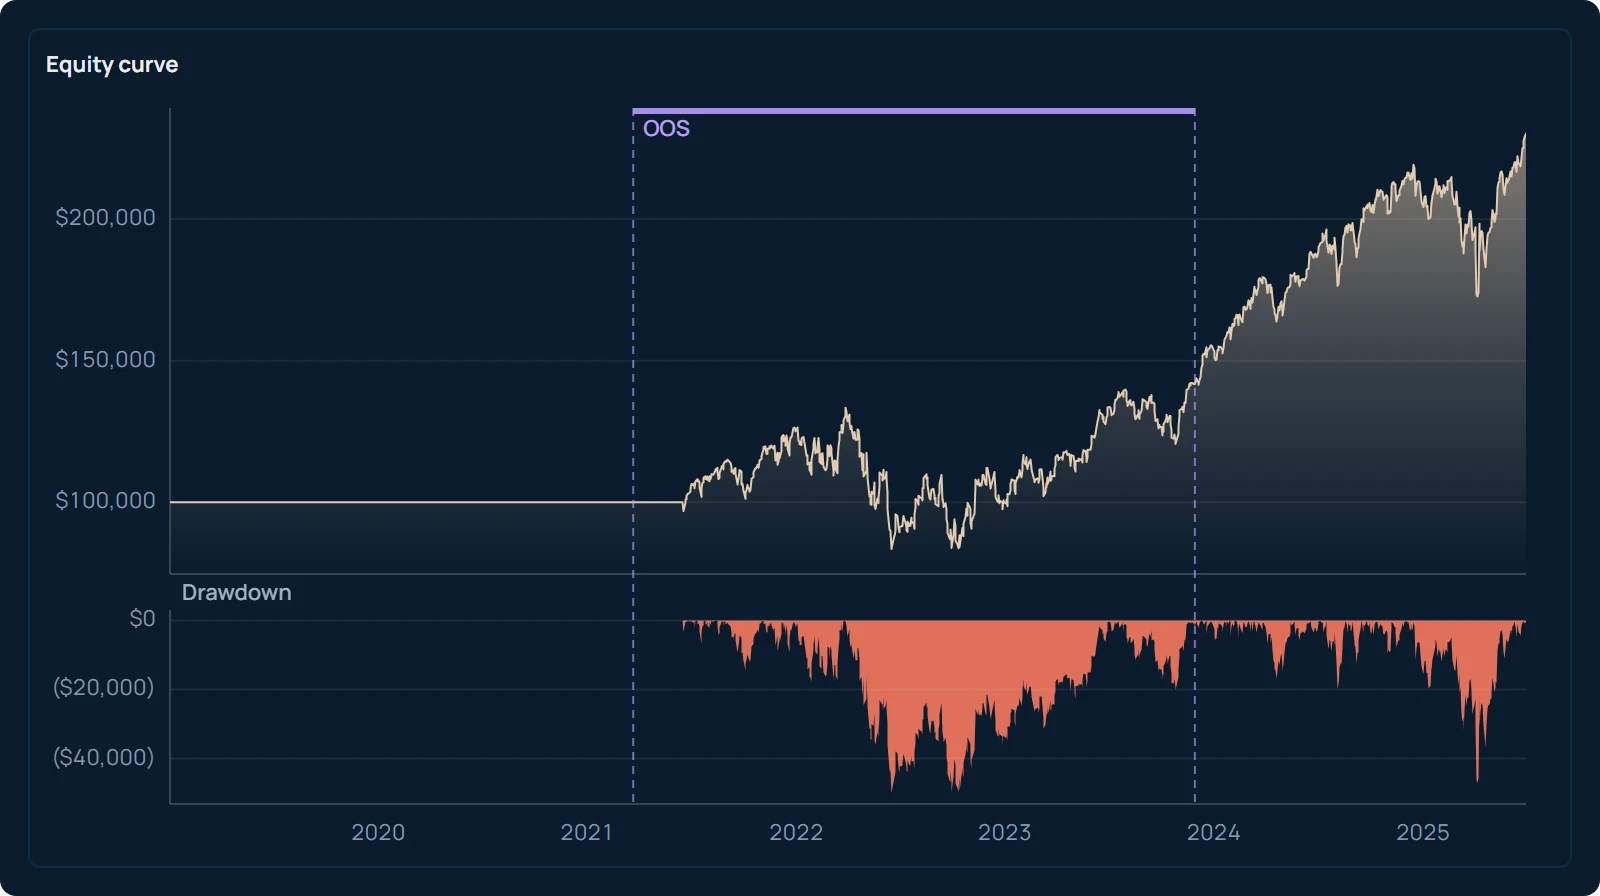
How to read this report: six and a half years produce only 41 trades, which is a small sample. Time in market of 93.75% means it is almost always in a position, which is typical of a long-and-short reversal rule. A large share of the net profit is effectively riding the direction of the index itself rather than anything the rule picked out. And a maximum drawdown of $60,292.5 against net profit of $94,192.5 is a large ratio. With 1 contract, you need an account that can stand that drawdown. These readings apply to all four types: first ask whether the trade count is enough, how long the strategy stays in the market and how deep the drawdown goes, then ask how much it made. The strategy databank on AlphaPrime can save and rank candidates across types, periods and cost settings, so when you compare which type led in which historical stretch, you are not relying on memory.
Back to the question itself: no single type leads in every period. In a one-directional market, trend and breakout types lead, while mean-reversion types take repeated hits. In a range-bound market, mean-reversion types lead, while trend types keep entering and exiting and take small losses. Park and Irwin (2007) reviewed a large body of research on technical trading rules, and one of their conclusions is that rule performance varies with period and market, and no rule set holds up across every sample. So "which quant strategy earns the most" can only be answered as: over which history, in which market, with how much cost, which type leads.
In practice, split the backtest period into segments and look at each type's performance in each segment, rather than only the total. Take S&P 500 futures as an example: the differences in how each rule type performed in different years, along with the backtest settings, are laid out in S&P 500 futures trading strategies: rule types you can backtest.
Which quant trading strategy suits a beginner?
A beginner's first choice should be a breakout strategy. Its rules are few, each entry's reason is easy to follow, and on daily bars a few years of data accumulates enough trades for the results to mean something beyond luck. "Buy on an N-day high, exit on an N-day low" fits in one sentence, and looking back at any trade you can point at the chart and say why it entered and why it exited. That matters for learning to read reports.
The other three types each have a threshold to clear first. Trend following has equally few rules, but as Section 2 showed, its trade count per year on daily bars is structurally low. You need a longer history, several markets, or a smaller timeframe to gather enough samples. A beginner can try it, but should confirm the trade count first. Mean reversion requires learning to handle single large losses first, which means understanding stops and position size before building. Momentum strategies have more conditions (lookback window, holding period, ranking or thresholds), and each entry's reason is harder to read at a glance, so leave it for later.
A workable starting sequence:
- Pick one instrument and one timeframe. Taiwan readers often start with mini TAIEX daily bars or 60-minute bars, since data is easy to get and contract specs are familiar.
- Write down one breakout rule and its costs. Enter on an N-day high, exit on an N-day low, and set round-trip costs at your broker's commission plus at least one tick of slippage.
- Run just one parameter set first and read the report's trade count, average trade, maximum drawdown and year-by-year results. Do not optimize yet.
- Then scan a parameter range and check whether neighboring values (for example 18, 20 and 22 days) give similar results. That is part of the validation in Section 7.
You can follow this path without writing code. Program trading on TAIEX futures, from zero to a first strategy with no code matches each step to the data and tools Taiwan readers will use. Another common starting point is asking an AI to turn your idea into rules. Any rule an AI writes should go through the same validation order as the next section, and you should check specifically whether its entry or exit conditions use information that is only known after the current bar closes, such as using the day's high to decide that day's entry.
How do you validate a quant trading strategy so that you can trust the backtest?
Validation is a sequence of steps, and you stop at any step you fail, rather than reviewing results and then adjusting the rules. The order is: write down your pass thresholds first, then run out-of-sample testing, walk-forward, doubled costs, a check on neighboring parameters, and removal of the largest winning trades. Finally, hold back a stretch of data you have never touched and test it once. The thresholds are written first because, once you have seen results, people tend to move the thresholds toward the results without noticing.
- Write down the thresholds. For example: out-of-sample average trade is at least half the in-sample average, at least 100 trades, still positive with doubled costs, and neighboring parameters have the same sign.
- In-sample search. Choose rules and parameters only on the first 70% to 80% of history.
- Out-of-sample test. Run the chosen rule, unchanged, on the remaining later segment, and compare the result with the thresholds from step 1.
- Walk-forward. Walk-forward repeats "tune on the earlier segment, test the later segment without changing anything" along the history, then links all the later segments together. Pardo (2008) treats it as a standard step after optimization. For a trend strategy that produces only a dozen trades a year, this step is also how you gather enough out-of-sample trades. For details see Walk-forward analysis: the only backtest number you can actually trade.
- Double costs and check neighboring parameters. Rerun with doubled slippage. Move each parameter up and down by one step, and check whether results move in the same direction.
- Remove the five largest winning trades. The remaining net profit should still be positive, so the profit is not coming from a few lucky trades.
- Hold back a stretch of untouched data and test it once. Run it only after the first six steps are passed, accept or reject it against the thresholds, and do not go back to change the rules.
The four types each stumble at different points in this process. Trend following gets caught at steps 4 and 6, on trade count and profit concentration. Mean reversion gets caught at step 5, doubled costs, and at the maximum-single-loss threshold you wrote in step 1. Breakout and momentum most often fail at step 5, doubled costs. AlphaPrime's strategy validation also works this way, stopping at each step: you set the thresholds before the search begins, and if a strategy fails an earlier check, the later checks do not run.
Here is a next step: take any strategy you currently have, use the table in Section 1 to decide whether it bets on continuation or reversion, then do one thing. Sort its trade list by P&L, remove the five largest winners, and see whether net profit stays positive. That one number will show whether it looks more like the trend report in Section 2, or whether it was just a few lucky trades.
Frequently asked questions
Are trend-following and momentum strategies the same thing?
Not exactly. Both bet that price will continue, but trend following usually judges direction by price's relation to a moving average or range, enters later and holds for weeks to months. A momentum strategy uses the sign or strength of returns over a period as its condition, enters earlier and holds for days to weeks. In backtests, momentum strategies produce more trades and are more sensitive to costs.
How much historical data does a quant strategy need?
Count trades, not years. Ten years of daily bars might hold only a few dozen trades for a trend strategy, while a mean-reversion or breakout strategy might have several hundred. A common rule of thumb is that out-of-sample you want at least several hundred trades before you trust the average trade; under thirty, it is only a lead. When the count is too low, use walk-forward, add more markets, or move to a smaller timeframe to get more samples.
Does a mean-reversion strategy always need a stop?
Not always, but you must know how large its largest single loss is without one. The weakness of mean reversion is the large loss from a one-directional move. A fixed stop or time stop can limit it, but at the cost of turning some trades that would have pulled back into losses. The right approach is to backtest with and without the stop, compare the largest single loss, the longest losing run and the net profit, then decide.
Can one strategy handle both trends and range-bound markets?
A single rule rarely can, because betting on continuation and betting on reversion cancel each other out within the same stretch of market. A common approach is to combine one trend-type and one mean-reversion-type strategy in a portfolio, so that each contributes in its own market. Another is to add a filter that identifies the market shape: trend rules on in single-direction periods, reversion rules on in range-bound periods. Either way, confirm the combined maximum drawdown in backtest rather than adding up each strategy's net profit.
References
- Bailey, D. H., Borwein, J., López de Prado, M., & Zhu, Q. J. (2014). Pseudo-Mathematics and Financial Charlatanism: The Effects of Backtest Overfitting on Out-of-Sample Performance. Notices of the American Mathematical Society, 61(5), 458–471.
- Moskowitz, T. J., Ooi, Y. H., & Pedersen, L. H. (2012). Time Series Momentum. Journal of Financial Economics, 104(2), 228–250.
- Park, C.-H., & Irwin, S. H. (2007). What Do We Know About the Profitability of Technical Analysis? Journal of Economic Surveys, 21(4), 786–826.
- Pardo, R. (2008). The Evaluation and Optimization of Trading Strategies (2nd ed.). John Wiley & Sons.