

Trade with algo: 6 checks before you go live with real money
Before you trade with an algo for real money, pass six checks in a fixed order: capital that covers the backtest drawdown with room to spare, rules you can read, a backtest with realistic costs, out-of-sample and walk-forward survival, a position size and paper-trading period set in advance, and written switch-off rules.
By Soren Huang · Published · updated · Editorial policy
Contents
- What should you check before you trade with an algo for real money?
- How much capital do you need to trade with an algo?
- Do you need to code to trade with an algo?
- Does the backtest include realistic costs and next-bar fills?
- Did the strategy survive out-of-sample and walk-forward checks?
- How do you set position size, check margin and paper trade?
- When do you switch the algo off?
- Frequently asked questions
- References
What should you check before you trade with an algo for real money?
Before you trade with an algo for real money, pass six checks in a fixed order: capital that covers the backtest drawdown with room to spare, rules you can read in plain words, a backtest with realistic costs, out-of-sample and walk-forward survival, a position size and paper-trading period set in advance, and written switch-off rules.
Algo trading is trading in which a written rule set decides every entry and exit and a program sends the orders. The program removes hesitation, but it also removes the pause in which a human would notice that something is wrong. The six checks put that pause back before the first order, when it costs nothing. If you are new to the idea, what algo trading is and why most rules lose explains the background that this article assumes.
- Capital against drawdown. The account holds the margin plus a buffer larger than the worst backtest drawdown.
- Readable rules. You can say every entry and exit rule aloud without looking at code.
- Costs in the backtest. Every trade carries commission, slippage and a next-bar fill.
- Out-of-sample and walk-forward. The frozen rules hold up on data they never saw.
- Position size, margin and paper trading. Contract count comes from a fixed risk per trade (the free position size calculator does the arithmetic), margin fits the worst day, and paper trading runs for a set number of trades.
- Switch-off rules. Three triggers with thresholds, written down before the first live trade.
The order matters. A strategy that fails a check does not move to the next one; you fix it or drop it. Checking position size for a strategy whose costs were never modelled is wasted work, because the costs may remove the edge entirely.
How much capital do you need to trade with an algo?
The capital you need is the margin plus a buffer that covers at least the largest backtest drawdown with room to spare, because the first live drawdown is often larger than the backtested one. Margin alone keeps the position open on a calm day. It does nothing for the string of losses that every strategy eventually has.
Drawdown is the fall from an equity high to the following low, measured before equity recovers. Think of a car trip: margin is the fuel to start the engine, the drawdown buffer is the fuel to reach the next station. Starting with fuel for the engine only means stopping on the first hill. The one formula in this article:
required capital = margin + 1.5 × backtest max drawdown + one year of costs
Here margin is the deposit the exchange and your broker require per contract, backtest max drawdown is the largest peak-to-low fall in the cost-inclusive backtest for the same contract count, and one year of costs is commission and slippage for the number of trades the backtest makes in a year. The factor 1.5 is a practical margin of safety, not a law. Bailey, Borwein, López de Prado and Zhu (2014) show why some allowance is needed: a strategy chosen as the best of many tries carries a selection bonus, so its backtest drawdown understates what new data will produce. Margin requirements change; check your exchange's contract page and your broker's current table before you fill in the number.
Hypothetical example
Margin for one contract: $20,000. Backtest max drawdown for one contract, after costs: $40,000, so the buffer is 1.5 × $40,000 = $60,000. The backtest makes about 30 trades a year at about $30 per trade, about $1,000. Required capital is about $81,000. Margin alone is one quarter of that. A trader who opens the account with $25,000 is not under-capitalized by a little; the account cannot survive one ordinary drawdown.
Different rule types produce different drawdown shapes: a trend strategy loses in many small steps, a mean-reversion strategy in a few large ones. The overview of futures algo trading strategy types and how to backtest each shows which shape to expect before you size the buffer.
Do you need to code to trade with an algo?
You do not need to write code to trade with an algo, but you must be able to read every entry and exit rule in plain words, because a rule you cannot explain is a rule you cannot judge or switch off. The coding question is about effort. The reading question is about safety, and it applies to both routes.
| Question | Write the code yourself | Generate and export rules |
|---|---|---|
| Skill needed | A platform language and debugging | Reading rules and reports |
| Time to first testable rule | Days to weeks | Hours |
| Who checks the logic | You, line by line | You, rule by rule in the exported source |
| What you must still read before going live | Every entry and exit rule, in plain words | Every entry and exit rule, in plain words |
A practical test: write the strategy on one page in sentences such as "go long at the next bar open when condition A has been true for two bars; exit when condition B is true or at the session close". If a sentence is missing, the backtest contains a rule you do not know about. The 30-day route to a first algo trading strategy builds this habit from the first week. If you take the no-code route, AlphaPrime (Valynox) writes the strategy out as source code for the trading platforms on its supported export platforms page, so the rules you read are the rules the platform runs.
Does the backtest include realistic costs and next-bar fills?
A backtest is a go-live input only when every trade carries commission, slippage and next-bar execution, and when the average trade is many times the cost per trade. Slippage is the difference between the price the backtest assumed and the price a real order would have filled at. Next-bar execution means a rule that decides on the close of a bar fills at the open of the following bar, because the close is known only after it has passed.
The run below shows what a cost-inclusive report looks like. It tested a stand-in rule, not a full strategy: a rule built on the ADX, an indicator that measures how strongly price is trending without saying which way, used as the only entry and exit, with no stop, no target and no filter. The market was NQ (E-mini Nasdaq-100) futures, daily bars, from 2019-01-02 to 2025-06-30, long and short, one contract, with $20 commission and $10 slippage charged on every trade.
Source: AlphaPrime product engine (CPU), run 2026-10-31. NQ daily bars, 2019-01-02 to 2025-06-30, long and short, 1 contract, $20 commission and $10 slippage per trade.
| Number | Result |
|---|---|
| Net profit (closed trades) | $102,875 |
| Max drawdown | $80,685 |
| Trades | 43 |
| Win rate | 58.14% |
| Profit factor | 1.436 |
| Average trade | $2,392.44 |
| Time in market | 41.52% |
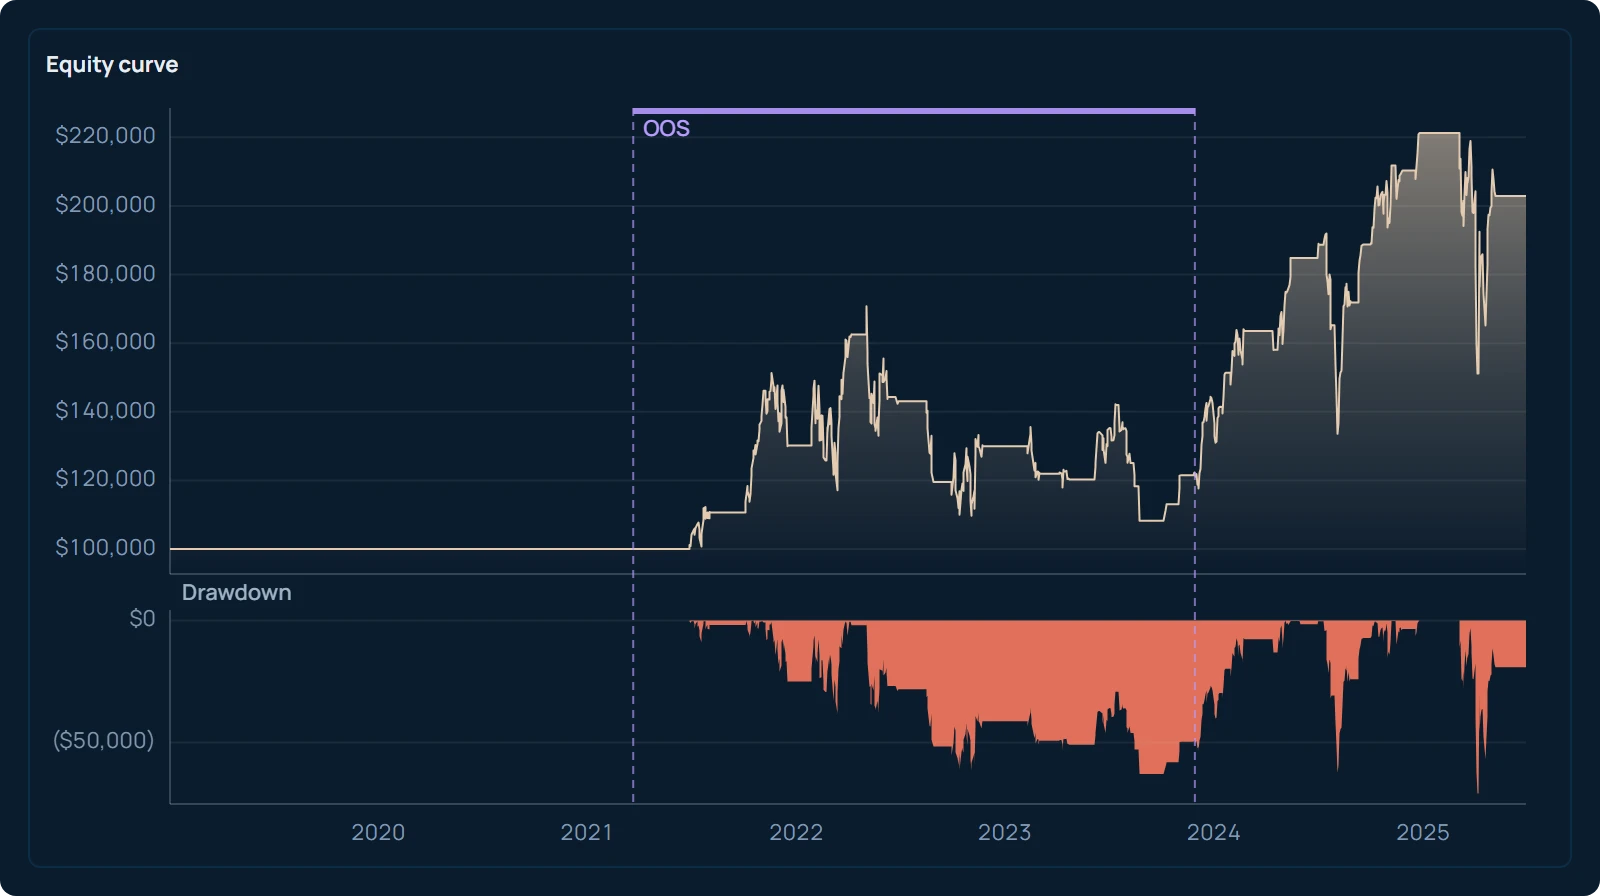
Two things in this report matter for the go-live decision. First, this is the one candidate the search kept out of 1,024 it tried, picked for its return against its drawdown. Picking the best one after the fact flatters it: among a thousand variants, some will look good on this history by chance alone, so the numbers describe the kept candidate on past data and say nothing about what the rule, or a reader, would earn. Second, the cost check passes easily: the average trade of $2,392.44 is roughly eighty times the $30 charged per trade in that run, so a doubling of slippage would barely change the result. The weak point is elsewhere. The max drawdown of $80,685 is about four fifths of the net profit of $102,875, and 43 trades in six and a half years is a thin sample. By the capital rule of the previous section, one contract of this rule would need a buffer of 1.5 times that drawdown on top of margin, which is the real cost of going live with it.
For an intraday rule with a small move per trade, the cost bar and the average-trade bar are close together, and that is where most live attempts end. The arithmetic of edge against cost is worked through in the numbers that decide whether algo trading pays for retail.
Did the strategy survive out-of-sample and walk-forward checks?
A strategy goes live only after its rules, frozen after tuning, hold up on data they never saw and across several walk-forward windows, judged with thresholds you wrote before the test. Out-of-sample data is the part of the history that was kept out of tuning and used once to grade the finished rules. Walk-forward analysis is a test that tunes settings on one window, runs them unchanged on the window that follows, moves forward, and repeats until the joined test segments form one result.
The two tests answer different questions from the same data. One split answers "did the rules tuned on 2019 to 2023 still work in 2024 and 2025?". The walk-forward run answers "did the tuning method keep working each time the market moved on?". A rule that passes the first and fails the second usually depended on one lucky choice of settings.
- Write the thresholds first: for example, out-of-sample average trade at least half of the in-sample figure, and at least three of four walk-forward windows positive after costs.
- Freeze the rules at the end of tuning. Any later change starts a new candidate.
- Run the single split, then the walk-forward, with the same costs and next-bar fills as the original backtest.
- Accept or reject by the thresholds, not by how the curve looks. Pardo (2008) describes the walk-forward procedure and the reasoning behind judging it by rules set in advance.
Harvey and Liu (2015) add the point that matters when you test many candidates: the more variants compared on one history, the higher the bar a survivor must clear. When the thresholds are typed in before the search runs, as in the pass-or-fail stages of strategy validation in AlphaPrime, a candidate that fails the single split never reaches the walk-forward stage, and the later data stays unseen by the rejects. Window lengths and how to read the joined curve are covered in walk-forward analysis and the one backtest number you could have traded.
How do you set position size, check margin and paper trade?
Size one contract per fixed fraction of account risk, confirm that intraday and overnight margin fit the account on the worst day, and paper trade for a set number of completed trades rather than a set number of weeks. These three settings are decided on paper and then left alone; changing them during the paper period restarts it.
Position size comes from two numbers: the money you are willing to lose on one trade, often one to two percent of the account, and the money one contract loses when its stop is hit. Divide the first by the second and round down to whole contracts. For a rule without a stop, such as the stand-in run above, use the largest single losing trade in the backtest as the per-contract loss. The tool linked in the first section does this division for any contract.
Margin is the deposit the exchange and broker hold against an open position; intraday margin is usually lower than the overnight figure, and a position held through the close must meet the higher one. Check the overnight margin for the full contract count against the account on the worst backtest day, that is, at the bottom of the max drawdown, not at the starting balance. If the account at that point does not cover overnight margin for every contract, cut the contract count until it does.
Paper trading is running the strategy on live prices without money, to compare its real-time behaviour with the backtest. Its job is to collect a sample of fills, so count it in trades. A target of about 30 completed trades is the smallest sample from which an average fill difference means much; the exact number is your choice, as long as you write it down first.
Hypothetical example
Target: 30 paper trades. A daily-bar strategy that trades about 7 times a year needs more than four years to reach it, which is impractical; its trader checks fill quality on the first 10 trades and relies more heavily on the walk-forward result. An intraday strategy that trades twice a day reaches 30 trades in about 15 trading days, roughly three weeks.
During the paper period record three numbers per trade: the signal price from the backtest logic, the paper fill price, and the time between the two. The gap between the first two is your measured slippage, and it feeds the second switch-off rule below.
When do you switch the algo off?
Write the switch-off rules before the first live trade: a drawdown limit tied to the backtest, a gap between live and backtest fills, and a technical fault list, so the decision is made by a rule and not by mood. A trader who decides during a losing week will either stop too early, after normal noise, or too late, after the account is damaged. The rules fix both.
| Trigger | Threshold written in advance | Action |
|---|---|---|
| Drawdown | Live drawdown reaches 1.5 times the backtest max drawdown for the same contract count | Stop, then review |
| Fill gap | Average live slippage over the last 20 trades is above the slippage assumed in the backtest | Stop, then review |
| Fault | Any missed order, data gap or platform disconnect while a position is open | Stop, then review |
The drawdown trigger uses the same 1.5 factor as the capital rule, so the account is sized to survive the stop level. The fill-gap trigger catches a change in the market or in the broker's routing before it shows up in the equity curve; a strategy whose average trade is close to its cost per trade is the first to need it. The fault trigger exists because a program that misses one exit order holds a position its rules would have closed, and no backtest covers that. "Review" means rerunning the validation of the fifth section on the history that now includes the live period, with the rules still frozen. If the rerun passes, the same strategy may restart with the same thresholds; if it fails, the live period has done its job.
A concrete next step: take the cost-inclusive report of the strategy you plan to trade, write down its max drawdown for your contract count, multiply by 1.5, add margin and a year of costs, and compare the total with your account. That one number settles the first check, and if it fails, the other five can wait.
Frequently asked questions
How much money do you need to start algo trading?
Enough to hold the margin for your contract count plus a buffer of at least 1.5 times the largest drawdown in a cost-inclusive backtest, plus a year of commission and slippage. Margin alone keeps a position open on a calm day; the buffer is what carries the account through the losing streak every strategy has. Starting with margin only is the most common reason a live attempt ends in its first months.
Do you need to know programming to trade with an algo?
No. A strategy can be generated and exported as source code without writing it by hand. What cannot be skipped is reading: before going live you must be able to say every entry and exit rule in plain sentences. A rule you cannot explain is one you cannot judge when it behaves strangely or decide to switch off.
Can algo trading make money?
Whether a given rule set pays depends on three numbers after costs: the average trade compared with the cost per trade, the max drawdown compared with the capital, and how the rules behave on data they were not tuned on. A backtest reports what those numbers were on past prices and is not a forecast. Most rules fail at the first number once realistic commission and slippage are charged, which is why the cost check comes before position sizing.
What should you check before going live with an algo?
Six things, in order: capital against the backtest drawdown, rules you can read, a backtest with commission, slippage and next-bar fills, out-of-sample and walk-forward survival against thresholds written in advance, position size and margin on the worst day plus a paper-trading period counted in trades, and written switch-off rules. A strategy that fails one check is fixed or dropped before the next.
How long should you paper trade before going live?
Count completed trades, not weeks. A sample of about 30 trades is the smallest from which an average fill difference tells you much; an intraday strategy collects that in a few weeks, a daily-bar strategy may need years, so slow strategies lean more on walk-forward results and check fill quality on their first trades. Record the signal price, the fill price and the delay for each trade, and set the number before you start.
References
- Bailey, D. H., Borwein, J., López de Prado, M., & Zhu, Q. J. (2014). Pseudo-Mathematics and Financial Charlatanism: The Effects of Backtest Overfitting on Out-of-Sample Performance. Notices of the American Mathematical Society, 61(5), 458–471.
- Harvey, C. R., & Liu, Y. (2015). Backtesting. The Journal of Portfolio Management, 42(1), 13–28.
- Pardo, R. (2008). The Evaluation and Optimization of Trading Strategies (2nd ed.). John Wiley & Sons.