

Did Jim Simons trade gold? Myth, facts and a futures test
No public record shows Jim Simons getting rich on gold. His first funds traded currencies and several commodities, and Medallion spread thousands of short positions across many markets. A trader who wants a gold strategy tests a written rule on gold bars with costs and an out-of-sample block, not on a famous name.
By Soren Huang · Published · updated · Editorial policy

Contents
Did Jim Simons start with gold?
The Jim Simons gold story is mostly myth: no public record shows that he got rich on gold. His first funds traded currencies and a range of commodities, first on judgment and later on early models. Medallion, the fund that made his name, spread thousands of small positions across many markets. Gold was at most one of them.
What is documented is this. Simons left academia and set up a currency trading firm in 1978, working with the mathematician Leonard Baum. The early years mixed human judgment with simple models, and the firm traded currencies and several commodities with large swings in results (Zuckerman, 2019). The Medallion fund started in 1988 and became fully systematic only in the following years. None of these accounts describes a gold position as the source of the fortune. The legend most likely grew from a few early commodity trades retold many times, in a period when gold was often in the news.
This matters for a practical reason. A trader who believes "Simons made his money in gold" tends to treat gold as a special market with a known edge. The argument of this article is the opposite: a famous name is not evidence about a market. The only evidence that counts for your account is a test of your own rule on gold's own bars.
Why is Medallion not a gold fund?
Medallion could not have been a gold fund because its method depended on many small bets, not on one big market. The fund traded thousands of instruments at once, with holding periods of days or less, and each position was small relative to the whole (Zuckerman, 2019). A holding period is the time between opening a trade and closing it. When thousands of short trades run in parallel, no single market decides the result, and the result comes from a small average edge repeated very many times.
Compare two portfolios. A single-market fund puts everything into gold, so its year is gold's year. A fund spread over thousands of instruments owns a sliver of gold, a sliver of a currency pair, a sliver of a stock, and so on. If gold has a bad run, it moves one small block in a large grid. Cornell (2019) studies Medallion's published return history as a statistical outlier and does not tie it to any one market; a reader interested in what a retail trader can and cannot copy from this approach will find the full picture in what a retail trader can actually copy from Renaissance.
Short holding periods also carry a lesson that transfers directly to a retail account: the more often a rule trades, the more commission and slippage it pays, and the average trade must clear that cost before anything else is worth reading. The arithmetic is the same one explained in how to test a day trading strategy after costs. A gold rule that trades twice a week faces a very different cost hurdle from one that trades twice a year.
Did Medallion trade gold at all?
Very likely yes, among many other futures markets, but nobody outside the firm can show how much or how well. Medallion's positions were never published. The firm describes its universe only in broad terms, as thousands of liquid instruments, and metals futures are among the most liquid futures that exist, so it would be surprising if gold was absent. That is a reasonable inference, not a documented fact.
Public positioning data does not fill the gap. The Commitments of Traders reports of the CFTC show open positions in gold futures by category of trader, such as managed money or commercials, and never by fund name (U.S. Commodity Futures Trading Commission, Commitments of Traders). A trader can see that the managed-money category is long or short gold; a trader cannot see what any one fund holds, how long it held it, or whether the position made money. So a sentence such as "Medallion was heavily long gold" has no source anyone can check.
The practical rule follows: do not build a gold thesis on this gap. Where positioning data is public and complete, it can be tested as a signal in its own right; the method in testing the Mini-TAIEX retail long-short ratio as a signal shows how a published ratio becomes a testable rule with a date-ordered split. Medallion's book is the opposite case: private, aggregated away in public reports, and useless as a signal.
How do systematic traders approach gold futures?
A systematic gold futures strategy is a written rule, tested on gold's own bars, with the exchange's session hours, contract specifications, commission and slippage set before anyone looks at a profit figure. Gold futures trade on COMEX, part of CME Group, almost around the clock on weekdays. The free futures market hours tool shows the session and its daily break in your own time zone. Contract size, tick value and margin are set by the exchange and can change, so read them from the exchange's contract page for the gold futures contract before every test. The contract and roll details that a gold backtest needs are collected in gold futures backtesting: specs, margin and trading hours.
Trend following is the most common rule family for gold. Trend following is a rule that enters in the direction of the recent price movement and stays in until that movement reverses by a defined amount. Gold has had long runs in both directions over the past decades, which is exactly what a simple trend rule can be tested against: the question is whether the runs were long enough and clean enough to pay for the many small losses between them. Gold options exist too, but futures are easier to test because a futures position has one price, no expiry decay and no volatility input; the reasons are set out in futures vs options for beginners: which is easier to test.
- Get gold futures bars and check the rolls. A continuous series is stitched from many contracts; each roll date must be known and the price gaps handled consistently.
- Set the session and the bar size. Decide whether the rule sees the full electronic session or only part of it, and whether it works on daily or intraday bars. Both choices change the trade count.
- Enter commission and slippage per trade. Use your broker's fee and at least one tick of slippage per side for market and stop orders.
- Write the trend rule and its parameter ranges. Fix the lookback range and the exit before the first run, so the search space is defined in advance.
- Hold back an out-of-sample block and write the pass rule. An out-of-sample block is a stretch of recent history that no search touches, used once to grade the kept candidate.
Hypothetical example
Suppose a gold trend rule on daily bars makes 40 trades in two years and shows a gross average trade of $300. Commission and slippage together cost $45 per round trip. The net average trade is $255, about six times the cost, so a doubling of slippage would still leave the rule positive. Now suppose a faster version on hourly bars makes 400 trades with a gross average trade of $60. After the same $45 cost, $15 per trade remains, and a doubling of slippage turns it negative. Same market, same idea, very different robustness to costs.
What does a trend rule look like when it is tested?
Our own run shows the shape of such a test, with one important substitution: it tests a stand-in Linear Regression trend rule on ES daily bars, not on gold. The run uses a stand-in rule built from a standard indicator rather than the gold strategy itself, so its numbers describe the test method, not gold. A Linear Regression trend rule fits a straight line through recent closing prices and uses the direction of that line as its signal; in this run that signal was the only entry and the only exit, with no stop, no target and no filters.
The search tried 1,024 parameter candidates on ES daily bars from 2019-01-02 to 2025-06-30, long and short, one contract, and kept the single candidate with the best return against its drawdown. Picking the kept one after the fact flatters it, a point the next section takes up. AlphaPrime (Valynox) charged the $20 commission and $25 slippage inside every one of those 1,024 evaluations with next-bar execution, which is why the figures below are already net of costs; how backtesting applies fees, slippage and sessions to each candidate is described on its feature page.
Source: AlphaPrime product engine (CPU), run 2026-10-31. ES daily bars, 2019-01-02 to 2025-06-30, long and short, 1 contract, $20 commission and $25 slippage per trade.
| Number | Result |
|---|---|
| Net profit (closed trades) | $88,920 |
| Max drawdown | $64,710 |
| Trades | 129 |
| Win rate | 55.04% |
| Profit factor | 1.331 |
| Average trade | $689.3 |
| Time in market | 86.29% |
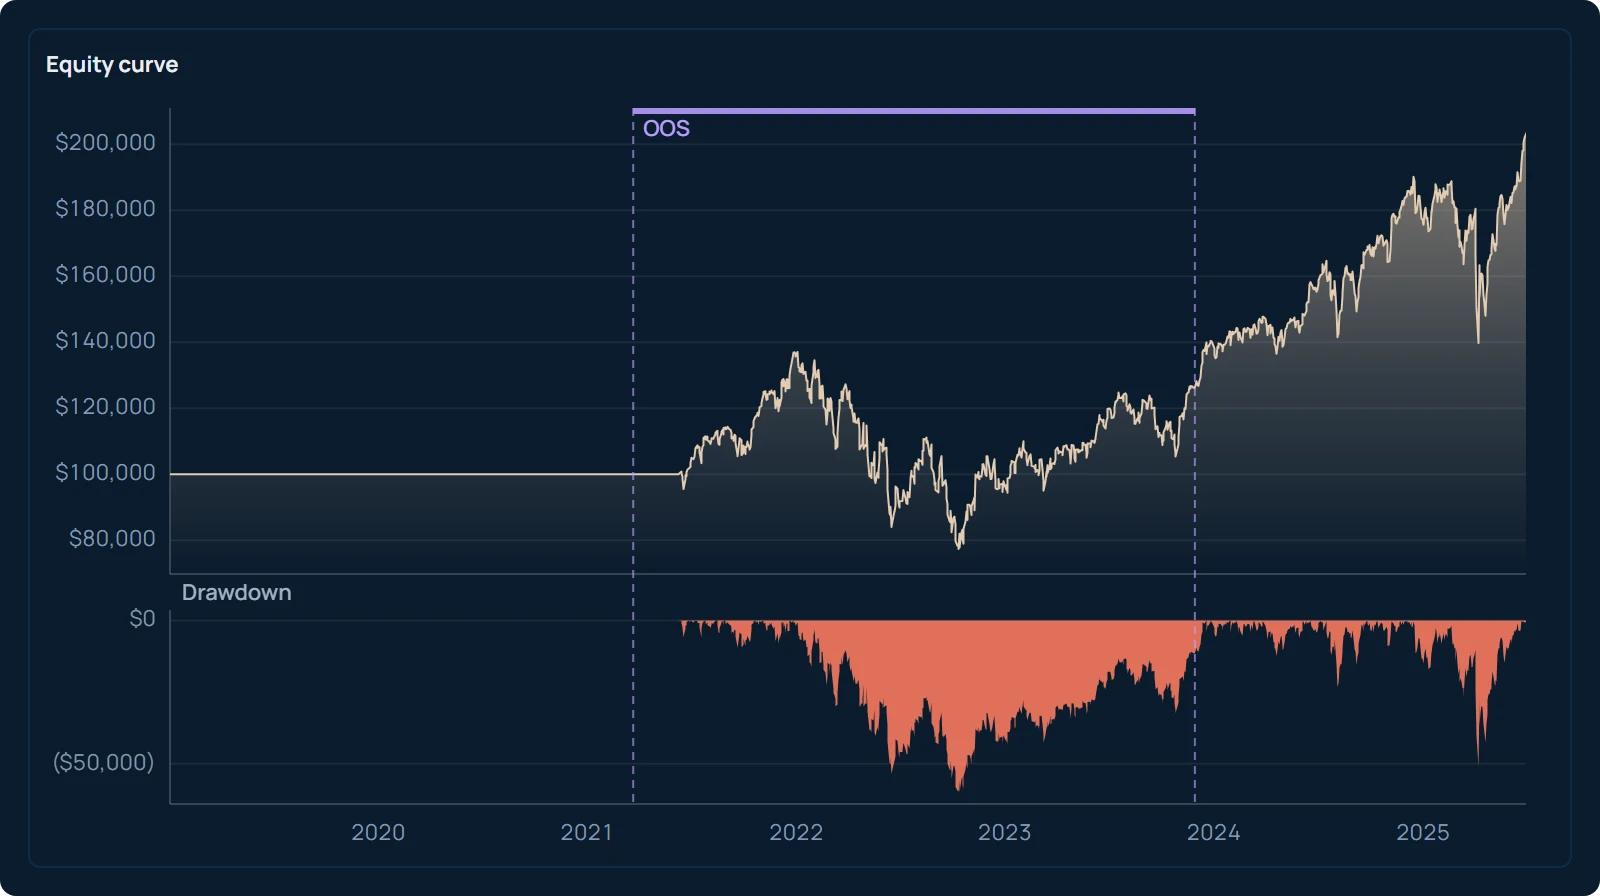
What the box tells a reader about the test, not about ES or gold: the kept candidate produced 129 trades over about six and a half years, a 55.04% win rate, a profit factor of 1.331, and an average trade of $689.3 that sits well above the combined commission and slippage. Time in market of 86.29% means the rule was in a position most of the time, which is typical of a trend rule with no filter: it is almost always long or short, and its equity moves with the market for most of the period.
How should you read these results with caution?
Read the box as a reason to run the same test on gold bars with an out-of-sample block, not as a reason to trade. Three facts in the box itself explain why. First, the kept candidate is the best of 1,024 by construction. A selection bonus is the part of a result that comes from choosing the best of many candidates rather than from the rule itself; Bailey, Borwein, López de Prado and Zhu (2014) show that the more candidates a search compares on the same data, the larger this bonus becomes, and that the top candidate's in-sample figures are expected to be inflated. The run did not hold back an out-of-sample block, so none of its numbers has yet been graded on data the search never saw.
Second, the max drawdown of $64,710 is close to three quarters of the $88,920 net profit. A trader with one contract would have watched most of the gain disappear at some point before it came back, and with the selection bonus removed the real drawdown is likely to be deeper. Third, 129 trades is a thin sample. An average trade built from 129 results can move a long way if a handful of large trades are replaced, which is exactly what a different period, or a different market such as gold, would do.
The useful next step is the test that this run did not include. Load gold futures bars with the rolls checked, set the session, enter your broker's commission and at least one tick of slippage per side, and define the same kind of trend rule with its parameter ranges. Then hold back the most recent block of history, run the search on the rest, and grade the kept candidate on the held-back block exactly once against a pass rule you wrote before looking. The split sizes and the pass rule are explained in how to split in-sample and out-of-sample data and how much is enough. If the out-of-sample average trade keeps a fair share of the in-sample figure after costs, you have a gold result worth carrying forward. If it does not, you have learned something about gold that no story about Jim Simons could have told you.
Frequently asked questions
What did Jim Simons trade in his early funds?
His first firm, set up in 1978, traded currencies, and in the following years it also traded a range of commodities, first on judgment and then with early models. Results in those years swung widely. The public record does not single out gold as the market that made the firm's money, and the fully systematic approach that Medallion is known for came later.
Did Medallion trade gold?
Very likely, as one market among thousands of liquid instruments, but the fund's positions were never published. Public reports such as the CFTC Commitments of Traders show gold positions only by trader category, never by fund. Nobody outside the firm can show how much gold Medallion traded or whether it made money on it.
Is gold a good market for trend following?
Gold has had long price runs in both directions, which gives a trend rule something to test against, but a run on a chart is not a result. Whether a specific rule captures those runs after commission and slippage, and keeps doing so on data it was not tuned on, is only known after a backtest with costs and an out-of-sample block. Test the rule on gold bars before forming a view.
Can the ES result in this article be used for gold?
No. The run tests a stand-in Linear Regression trend rule on ES daily bars, and it is the best of 1,024 candidates chosen after the fact, so its numbers carry a selection bonus and describe a different market. Use it as an example of the test method and of what a report contains. For gold, repeat the test on gold futures bars with your own costs and a held-back block of recent data.
References
- Zuckerman, G. (2019). The Man Who Solved the Market: How Jim Simons Launched the Quant Revolution. Portfolio/Penguin.
- Cornell, B. (2019). Medallion Fund: The Ultimate Counterexample? Working paper, SSRN 3504766.
- U.S. Commodity Futures Trading Commission. Commitments of Traders. https://www.cftc.gov/MarketReports/CommitmentsofTraders/index.htm
- Bailey, D. H., Borwein, J., López de Prado, M., & Zhu, Q. J. (2014). Pseudo-Mathematics and Financial Charlatanism: The Effects of Backtest Overfitting on Out-of-Sample Performance. Notices of the American Mathematical Society, 61(5), 458–471.