

Who is Richard Dennis? The Turtle experiment and his breakout rule
Richard Dennis is the Chicago futures trader who grew a small stake into a large fortune by trend following and then proved, with the 1983 Turtle experiment, that his written rules could be taught to beginners. The lesson for systematic traders is that a rule followed through drawdowns matters more than the person behind it.
By Soren Huang · Published · updated · Editorial policy
Contents
- Who is Richard Dennis?
- How did Richard Dennis turn a small stake into a fortune?
- What was the Dennis and Eckhardt experiment?
- What are the Turtle trading rules?
- Where did Richard Dennis's drawdowns come from?
- What does Richard Dennis do now?
- Does a Dennis-style breakout still hold up on futures today?
- Frequently asked questions
- References
Who is Richard Dennis?
Richard Dennis is a Chicago futures trader who turned a small stake into a large fortune in the 1970s and 1980s by trend following, then proved with the 1983 Turtle experiment that his written rules could be taught to beginners. The lesson for systematic traders: a rule followed through drawdowns matters more than the person who wrote it.
Trend following is a trading style that buys after prices rise to a new high, sells after prices fall to a new low, and holds the position while the move continues. Dennis did not predict markets. He reacted to them with a fixed set of rules and accepted many small losses to stay in for the few large moves. That makes him a different kind of legend from a data-driven quant. The article on what a retail trader can copy from Jim Simons and Renaissance describes a method built on thousands of small statistical signals that no one person could write down on paper. Dennis's method fits on a few pages, and he handed those pages to strangers.
How did Richard Dennis turn a small stake into a fortune?
Dennis grew his account by moving from quick trades in the Chicago pits to futures positions held for weeks in trending markets, and by letting a few large winners pay for many small losses. According to Covel (2007), he started on the Chicago floors around 1970 with a few thousand dollars, part of it borrowed, and by the early 1980s his fortune was reported in the hundreds of millions of dollars.
The change in holding period was the change that mattered. Pit scalping means buying and selling many times a day for a tick or two, where the edge per trade is small and the cost per trade eats most of it. The article on day trading explained and how to test it after costs shows the arithmetic: many trades with a tiny gross edge rarely survive commission and slippage. A multi-week trend trade pays costs once and can capture a move hundreds of times larger than the cost. Dennis also chose futures rather than options as his vehicle, because a futures contract moves point for point with the underlying market and has no time decay to fight; the comparison in futures vs options for beginners explains why that makes futures the easier instrument to test and to hold through a long trend.
What was the Dennis and Eckhardt experiment?
The Turtle experiment was a bet between Dennis and his partner William Eckhardt about whether great traders are born or made, settled by teaching one written rulebook to recruits with little experience and funding them with Dennis's own money. Covel (2007) gives the full account. Dennis believed trading could be taught; Eckhardt believed it depended on something innate. The name came from a turtle farm Dennis had seen in Singapore: he said he would grow traders the way the farm grew turtles.
- Recruitment (late 1983). Newspaper advertisements invited applications. Those selected came from many backgrounds, and most had little or no trading experience.
- Teaching (two weeks). The recruits sat in a classroom in Chicago and learned one set of rules: what to buy, when to sell, how much to hold and when to stop.
- Funding. Each recruit traded an account of Dennis's money. The accounts were real, and the losses were his.
- Judgment. Recruits were judged first on whether they followed the rules, and only then on results. Account sizes were adjusted on that basis.
The design is what makes the experiment useful to a systematic trader. The variable being tested was the method, not the talent of the recruits. Trading ran for roughly four years, until 1988, and Covel reports that the group as a whole was profitable while following the rules, which is the result Dennis had predicted. The experiment is the clearest real-world evidence that a trading method can be fully written down and executed by someone other than its author.
What are the Turtle trading rules?
The Turtle rules are one complete system with four connected parts: a price-channel breakout entry, a shorter channel exit in the opposite direction, a stop and position size tied to recent volatility, and limits on how many units one trader may hold. The parts were taught together, and the rules as later published by former Turtles and summarised in Covel (2007) make clear that the entry signal alone was the least important part.
- Entry. Buy when price trades above the highest high of the last N days; sell short when it trades below the lowest low. This channel is the same idea as the Donchian channel.
- Exit. Close a long when price falls below the lowest low of a shorter channel; close a short on the mirror signal. The exit channel is shorter than the entry channel, so the system gives back part of each move rather than waiting for a full reversal.
- Stop and size. Both use N, the Turtles' name for a 20-day average true range. The average true range is the average daily movement of a market over a set number of days, including any gap from the previous close. The stop sits two N below a long entry. Position size is set so that one N of movement costs a fixed fraction of the account, about one percent.
- Limits. A trader could add units to a winning position at fixed steps of N, up to a ceiling per market, per group of related markets, and per direction. The limits capped how much correlated risk one person could carry.
The one formula worth knowing is the unit size:
contracts per unit = (1% of account) ÷ (N × dollar value of one point)
Here 1% of account is the money you are willing to see move in one average day, N is the 20-day average true range in points, and the dollar value of one point is what one point of price change is worth on one contract. A volatile market gets fewer contracts, a quiet market gets more, so every position carries about the same daily risk. The free position size calculator does the same arithmetic from account risk and stop distance.
Hypothetical example
Account $100,000, so 1% is $1,000. Suppose a futures contract is worth $10 per point and its N is 100 points. One N on one contract is 100 × $10 = $1,000, so one unit is one contract. The stop sits 2N = 200 points below entry, a loss of $2,000, or 2% of the account, if hit. If N doubles to 200 points in a volatile month, one N on one contract becomes $2,000, and the unit shrinks to half a contract, which rounds down to zero: the rules would not take the trade at this account size.
The Turtles ran two settings side by side, usually with part of the account in each. System 1 used a shorter channel and included a filter: a breakout was skipped if the previous breakout in that market would have been a winner. System 2 used a longer channel and took every signal.
| Setting | System 1 (shorter channel) | System 2 (longer channel) |
|---|---|---|
| Entry channel | 20-day high or low | 55-day high or low |
| Exit channel | 10-day low (for longs) | 20-day low (for longs) |
| Filter | Skip the signal if the last breakout won | None |
| Typical hold | Shorter, weeks | Longer, often months |
| Trades per year | More | Fewer |
| In a long trend | Enters early, may exit on a pullback and re-enter | Enters later, holds through more pullbacks |
| In a sideways market | More false breakouts, more small losses | Fewer signals, fewer losses |
Where did Richard Dennis's drawdowns come from?
Dennis's drawdowns came from the same breakout rule that captured his best trends, because in sideways years the rule enters near the top of a range and exits lower, again and again, until a trend finally arrives. A drawdown is the fall in account value from a previous peak to the lowest point before a new peak is made. For a trend follower the drawdown is not a malfunction. It is the cost of being positioned for every breakout so as not to miss the one that runs.
The record shows how large that cost can be. Covel (2007) reports that Dennis's funds suffered heavy losses in 1987 and 1988, after which he stopped managing client money, and that a later fund he ran in the 1990s was closed around 2000 after another deep losing stretch. The point for a systematic trader is uncomfortable. A rule can have a positive long-run record and still force its owner through a drawdown he cannot survive, financially because clients withdraw or margin is called, or emotionally because he stops following the rule at the bottom. Before trading any breakout system, measure its worst historical fall with the free drawdown calculator and decide whether you could hold the position at that point with the account size you plan to use.
What does Richard Dennis do now?
Dennis stepped back from managing outside money after the losses around 2000 and has since been known mainly for the Turtle legacy and for his public commentary, not for running a fund. He has given interviews, appeared in books about trend following and taken part in public policy discussion, while the day-to-day trading of his rules has been carried on by others.
That last point is the practical one. Several of the original Turtles went on to run their own trading firms, and the rulebook has been published, tested and traded by people who never met him. A method that outlives its author's own trading career is exactly what the 1983 experiment set out to prove was possible. For the reader this means the question is no longer "could Dennis trade?" but "does his rule still hold up on the markets I trade, with today's costs?"
Does a Dennis-style breakout still hold up on futures today?
A plain N-day breakout on NQ daily bars still produced a positive net result over 2019 to mid-2025 in our run, but its maximum drawdown was almost as large as its net profit, which is the Turtle drawdown problem in modern form. The run below tested a stand-in rule, not the Turtle system: an N-day breakout used as the only entry and the only exit, no stop, no target, no filter, one contract, long and short, on NQ daily bars from 2019-01-02 to 2025-06-30. The candidate shown is the one AlphaPrime (Valynox) kept out of 1,024 it tried, chosen for its return against its drawdown.
Source: AlphaPrime product engine (CPU), run 2026-10-31. NQ daily bars, 2019-01-02 to 2025-06-30, long and short, 1 contract, $20 commission and $10 slippage per trade.
| Number | Result |
|---|---|
| Net profit (closed trades) | $145,750 |
| Max drawdown | $129,920 |
| Trades | 78 |
| Win rate | 75.64% |
| Profit factor | 1.67 |
| Average trade | $1,868.59 |
| Time in market | 90.69% |
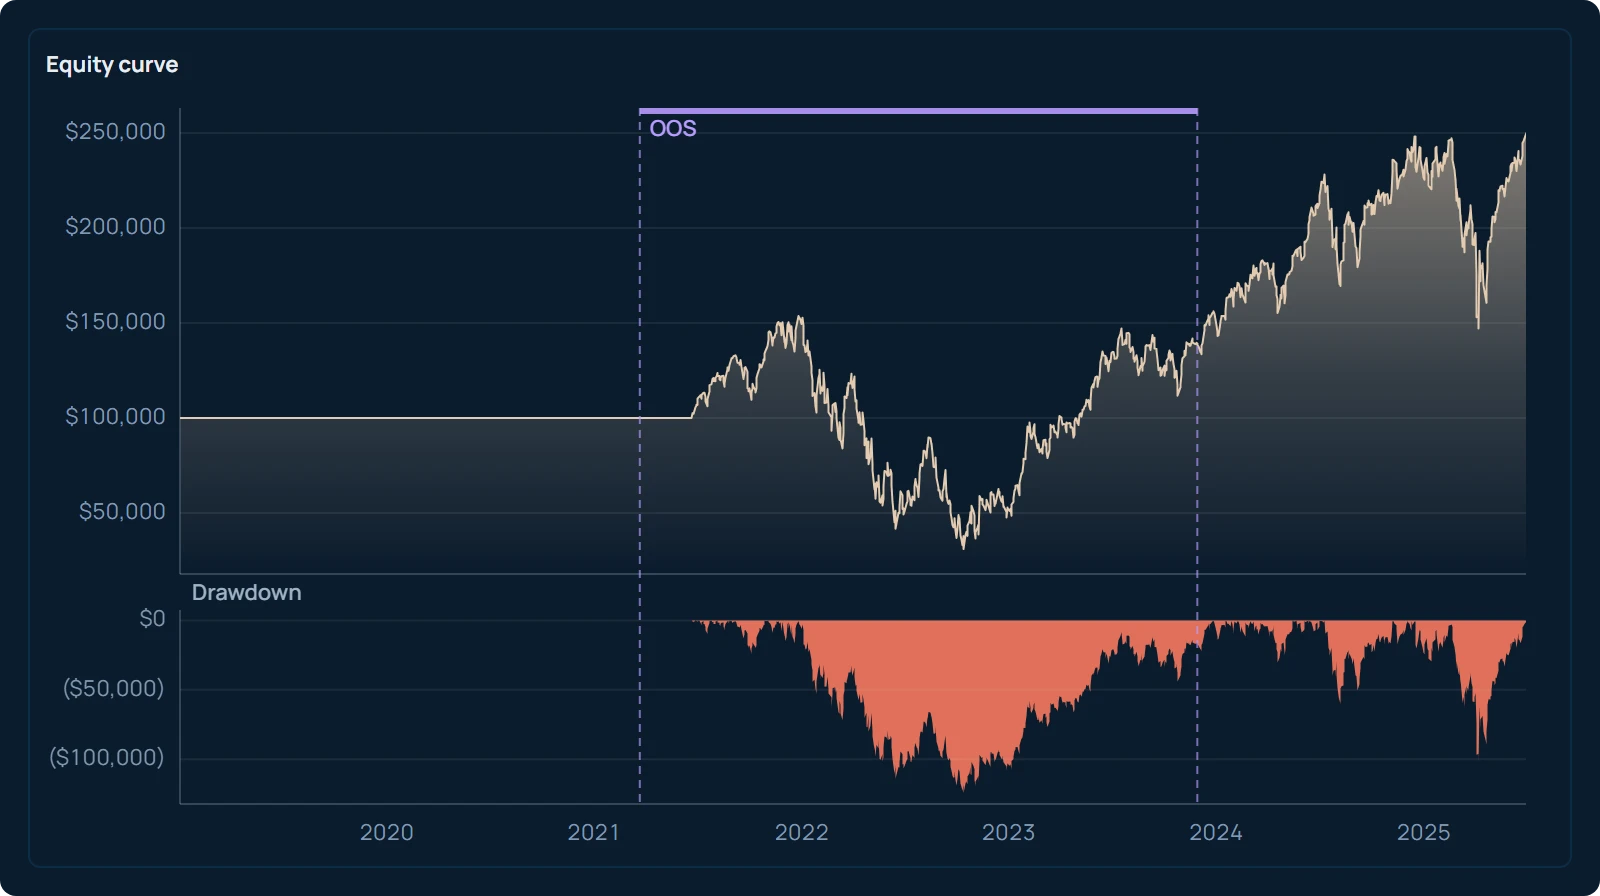
Read the numbers with two facts in mind. First, this is one candidate picked after the fact from 1,024, so the result flatters it: Bailey, Borwein, López de Prado and Zhu (2014) show that the best of many backtests is inflated by selection even when no single rule has any edge. Neither the breakout rule nor the N-day channel earned this money, and it is not a figure a reader can expect. Second, the stand-in leaves out most of what made the Turtle system a system, and the missing parts are the ones that controlled risk.
The honest test today is therefore not a single picked backtest but a walk-forward run of the whole system. Walk-forward analysis is a test that tunes the settings on one stretch of history, trades them unchanged on the stretch that follows, moves forward and repeats, so every result comes from settings chosen before the data existed. Run it with both channels, the 2N stop, one-percent units and the unit limits, across several unrelated futures markets, and compare the joined out-of-sample curve with the box above. In AlphaPrime this is the walk-forward step of strategy validation, with thresholds you set before the search so the Turtle rules are judged by a standard written in advance rather than by the one curve that looked best. Testing a published rule this way follows the same discipline described in Ernest Chan's lessons for backtesting a published rule: reproduce it exactly, add costs, then try to break it on data it never saw.
The research supports taking the idea seriously while distrusting any one curve. Moskowitz, Ooi and Pedersen (2012) document persistent time-series momentum across dozens of futures markets, which is the effect a breakout rule tries to capture. Whether a specific channel length on a specific contract still carries it after costs is a question only your own walk-forward run can answer. Load daily bars for three or four unrelated futures markets, set the 20/10 and 55/20 channels with 2N stops and one-percent units, write down the maximum drawdown you would accept, and run the walk-forward before you look at any in-sample curve.
Frequently asked questions
How much money did Richard Dennis make?
Published accounts such as Covel (2007) describe Dennis starting on the Chicago floors around 1970 with a few thousand dollars, part of it borrowed, and holding a fortune reported in the hundreds of millions of dollars by the early 1980s. The exact figure differs between accounts, and his funds later gave back large amounts in 1987–1988 and around 2000. The certain facts are that the fortune was large enough to fund the Turtle accounts from his own capital and that it was not a straight line.
What are the Turtle trading rules?
The Turtle rules are a complete trend-following system: enter on a breakout above the highest high or below the lowest low of a price channel (20 or 55 days), exit on the opposite breakout of a shorter channel (10 or 20 days), place the stop two average true ranges from entry, and size each unit so that one average true range of movement costs about one percent of the account. Limits cap how many units a trader may hold in one market, in related markets and in one direction. The shorter setting also skips a breakout if the previous breakout in that market would have won.
Is trend following still used today?
Yes. Trend following is the core method of many managed-futures funds and of individual systematic traders, and academic work such as Moskowitz, Ooi and Pedersen (2012) documents the time-series momentum effect it relies on across many futures markets. The rules in use today differ in channel length, volatility measure and market selection, and every version still passes through long sideways stretches with repeated small losses. Anyone considering it should test the full system, with stops and volatility sizing, on their own markets and costs.
What happened to the Turtles after the experiment?
The program ended in 1988 after about four years. Covel (2007) reports that several of the original recruits went on to found their own trading firms using rules descended from what they were taught, while others left trading. The original rules were later published, which is why the system can be tested by anyone today.
References
- Covel, M. W. (2007). The Complete TurtleTrader: The Legend, the Lessons, the Results. HarperBusiness.
- Moskowitz, T. J., Ooi, Y. H., & Pedersen, L. H. (2012). Time Series Momentum. Journal of Financial Economics, 104(2), 228–250.
- Bailey, D. H., Borwein, J., López de Prado, M., & Zhu, Q. J. (2014). Pseudo-Mathematics and Financial Charlatanism: The Effects of Backtest Overfitting on Out-of-Sample Performance. Notices of the American Mathematical Society, 61(5), 458–471.